【Python计量】异方差性的检验 |
您所在的位置:网站首页 › bp检验结果判断 › 【Python计量】异方差性的检验 |
【Python计量】异方差性的检验
|
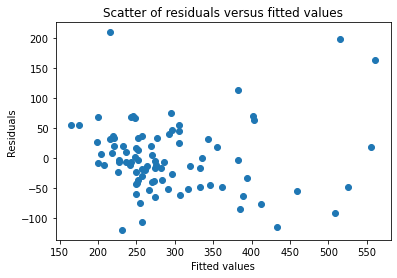
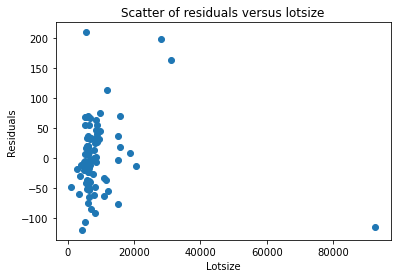
目录 一、画残差图 二、BP检验 (一)手动编制函数进行BP检验 (二)调用statsmodels的函数进行BP检验 三、怀特检验 (一)手动编制函数进行White检验 (二)调用statsmodels的函数进行White检验 四、Goldfeld-Quandt 检验 (一)手动编制函数进行GQ检验 (二)调用statsmodels的函数进行GQ检验 此文章首发于公众号:Python for Finance 链接:【Python计量】异方差性的检验 我们以伍德里奇《计量经济学导论:现代方法》的”第8章 异方差性“的案例8.4为例,使用HPRICE1中的数据来检验一个简单的住房价格方程中的异方差性。利用所有变量的水平值所估计的方程是: import wooldridge as woo import pandas as pd import statsmodels.api as sm import statsmodels.formula.api as smf import patsy as pt hprice1 = woo.dataWoo('hprice1') #建立回归模型: reg = smf.ols(formula='price ~ lotsize + sqrft + bdrms', data=hprice1) results = reg.fit() print(results.summary()) 一、画残差图由于残差可视为扰动项的实现值,故可通过残差的波动来考察是否存在异方差性。具体可以看: (1)残差与拟合值的散点图 (2)残差与某个解释变量的散点图 import matplotlib.pyplot as plt res=results.resid #从OLS回归模型中获取残差 fitted=results.fittedvalues #从OLS回归模型中获取拟合值 #残差与拟合值的散点图 plt.figure(1) plt.scatter(fitted,res) plt.xlabel('Fitted values') plt.ylabel('Residuals') plt.title('Scatter of residuals versus fitted values') plt.show() #残差与被解释变量lotsize的散点图 plt.figure(2) plt.scatter(hprice1['lotsize'],res) plt.xlabel('Lotsize') plt.ylabel('Residuals') plt.title('Scatter of residuals versus lotsize') plt.show()
假设回归模型如下: 假设同方差性,即 由于我们假定u的条件期望值为0,所以)),因而同方差性的原假设就等价于: 为了检验是否违背了同方差假定,我们想检验是否与一个或多个解释变量相关。若是错误的,则给定自变量,的期望值可能是x的函数。一个简单的方法就是假定一个线性函数: 同方差的原假设就是: 为检验解释的自变量的整体显著性,可用F或LM统计量来检验 (一)手动编制函数进行BP检验 hprice1['resid_sq'] = results.resid ** 2 #定义残差的平方 reg_resid = smf.ols(formula='resid_sq ~ lotsize + sqrft + bdrms', data=hprice1) results_resid = reg_resid.fit() bp_F_statistic = results_resid.fvalue bp_F_pval = results_resid.f_pvalue print(f'bp检验的F统计量: {bp_F_statistic}') print(f'bp检验的F统计量对应的p值: {bp_F_pval}') ''' bp检验的F统计量: 5.338919363241433 bp检验的F统计量对应的p值: 0.002047744420936033 '''F统计量5.34,对应的p值0.002,拒绝原假设;即模型存在异方差性。 (二)调用statsmodels的函数进行BP检验从statsmodels库的stats子模块的diagnostic工具中导入het_breuschpagan from statsmodels.stats.diagnostic import het_breuschpagan #BP检验het_breuschpagan函数的参数意义及返回结果 het_breuschpagan(resid, exog_het, robust=True) 参数介绍: resid:残差 exog_het:用于bp检验的自变量 返回值: lm : LM统计量值 lm_pvalue : LM统计量的p值,若p值小于显著性水平,则拒绝残差方差为常数的原假设,即存在异方差性 fvalue : F统计量值,用来检验残差平方项与自变量之间是否独立,如果独立则表明不存在异方差性 f_pvalue : F统计量对应的p值,若p值小于显著性水平,则拒绝**残差方差为常数的原假设**,即存在异方差性对上述模型做BP检验,代码如下: result_bp_test = het_breuschpagan(results.resid, reg.exog) bp_lm_statistic = result_bp_test[0] bp_lm_pval = result_bp_test[1] bp_F_statistic= result_bp_test[2] bp_F_pval = result_bp_test[3] bp_test_output=pd.Series(result_bp_test[0:4],index=['bp_lm_statistic','bp_lm_pval','bp_F_statistic','bp_F_pval']) print(bp_test_output) ''' bp_lm_statistic 14.092386 bp_lm_pval 0.002782 bp_F_statistic 5.338919 bp_F_pval 0.002048 dtype: float64 '''我们可以在het_breuschpagan函数的基础上,编制一个能返回异方差检验结果的函数。 def bp_test(res, X): result_bp_test = sm.stats.diagnostic.het_breuschpagan(res, X) bp_lm_statistic = result_bp_test[0] bp_lm_pval = result_bp_test[1] bp_F_statistic= result_bp_test[2] bp_F_pval = result_bp_test[3] bp_test_output=pd.Series(result_bp_test[0:4],index=['bp_lm_statistic','bp_lm_pval','bp_F_statistic','bp_F_pval']) return bp_test_output进行BP检验时,调用上述函数即可。 bp_test_output=bp_test(results.resid, reg.exog) print(bp_test_output) ''' bp_lm_statistic 14.092386 bp_lm_pval 0.002782 bp_F_statistic 5.338919 bp_F_pval 0.002048 dtype: float64 '''F统计量5.34,对应的p值0.002,拒绝原假设;LM统计量14.09,对应的p值0.0028,拒绝原假设。即模型存在异方差性。 三、怀特检验BP检验假设条件方差函数为线性函数,忽略了高次项。为此,怀特检验再BP检验的辅助回归中加入了所有的二次项(含平方项和交叉项)。 当模型包含k=3个自变量时,怀特检验则基于如下估计: 对原假设进行F检验或LM检验。 (一)手动编制函数进行White检验 hprice1['resid_sq'] = results.resid ** 2 reg_resid = smf.ols(formula='resid_sq ~ lotsize*sqrft*bdrms+I(lotsize**2)+I(sqrft **2)+I(bdrms**2)-lotsize:sqrft:bdrms', data=hprice1) results_resid = reg_resid.fit() white_F_statistic = results_resid.fvalue white_F_pval = results_resid.f_pvalue print(f'white检验的F统计量: {white_F_statistic}') print(f'white检验的F统计量对应的p值: {white_F_pval}') ''' white检验的F统计量: 5.386953445894593 white检验的F统计量对应的p值: 1.0129388323900798e-05 '''F统计量5.39,对应的p值接近于0,拒绝原假设;即模型存在异方差性。 (二)调用statsmodels的函数进行White检验从statsmodels库的stats子模块的diagnostic工具中导入het_white from statsmodels.stats.diagnostic import het_white #怀特检验het_white函数的参数意义及返回结果 het_white(resid, exog) 参数介绍: resid:残差 exog_het:用于white检验的自变量(只需要自变量的一阶形式,函数自动加入平方和交互作用项进行回归) 返回值: lm : LM统计量值 lm_pvalue : LM统计量的p值,若p值小于显著性水平,则拒绝残差方差为常数的原假设,即存在异方差性 fvalue : F统计量值,用来检验残差平方项与自变量之间是否独立,如果独立则表明不存在异方差性 f_pvalue : F统计量对应的p值,若p值小于显著性水平,则拒绝**残差方差为常数的原假设**,即存在异方差性对上述模型做怀特检验,代码如下: def white_test(res, X): result_bp_test = sm.stats.diagnostic.het_white(res, X) bp_lm_statistic = result_bp_test[0] bp_lm_pval = result_bp_test[1] bp_F_statistic= result_bp_test[2] bp_F_pval = result_bp_test[3] white_test_output=pd.Series(result_bp_test[0:4],index=['white_lm_statistic','white_lm_pval','white_F_statistic','white_F_pval']) return white_test_output white_test_output=white_test(results.resid,reg.exog) print(white_test_output) ''' white_lm_statistic 33.731658 white_lm_pval 0.000100 white_F_statistic 5.386953 white_F_pval 0.000010 dtype: float64 '''LM统计量F统计量5.39,对应的p值接近于0,拒绝原假设;LM统计量14.09,对应的p值0.0028,拒绝原假设。即模型存在异方差性。 四、Goldfeld-Quandt 检验Goldfeld-Quandt 检验由Goldfeld和Quandt于1965年提出。这种检验的思想是以引起异方差的解释变量的大小为顺序,去掉中间若干个值,从而把整个样本分为两个子样本。用两个子样本分别进行回归,并计算残差平方和,用两个残差平方和构造检验异方差的统计量。 (一)手动编制函数进行GQ检验 #按解释变量的大小做升序排列 hprice2=hprice1.sort_values(by="lotsize", ascending=True)#按指定的列(by=)排序,ascending=False为降序,True为升序 #去掉中间部分的值,分别选取前30组观测值和后30组观测值分别进行一元线性回归 #前30组一元线性回归 reg_first30= smf.ols(formula='price ~ lotsize +sqrft+bdrms',data=hprice2.iloc[0:30,:]) results_first30=reg_first30.fit() #后30组一元线性回归 reg_last30= smf.ols(formula='price ~ lotsize +sqrft+bdrms',data=hprice2.iloc[58:,:]) results_last30=reg_last30.fit() #F检验 F=results_last30.mse_resid/results_first30.mse_resid print("F=",F) ''' F= 1.658048702954414 '''若我们需要前30组一元线性回归和后30组一元线性回归结果,则输入代码: print(results_first30.summary()) print(results_last30.summary()) ''' OLS Regression Results ============================================================================== Dep. Variable: price R-squared: 0.119 Model: OLS Adj. R-squared: 0.017 Method: Least Squares F-statistic: 1.170 Date: Fri, 22 Apr 2022 Prob (F-statistic): 0.340 Time: 14:14:53 Log-Likelihood: -160.84 No. Observations: 30 AIC: 329.7 Df Residuals: 26 BIC: 335.3 Df Model: 3 Covariance Type: nonrobust ============================================================================== coef std err t P>|t| [0.025 0.975] ------------------------------------------------------------------------------ Intercept 94.3425 100.295 0.941 0.356 -111.817 300.502 lotsize 0.0098 0.010 0.981 0.336 -0.011 0.030 sqrft 0.0613 0.033 1.844 0.077 -0.007 0.130 bdrms -2.0513 15.173 -0.135 0.894 -33.241 29.138 ============================================================================== Omnibus: 19.188 Durbin-Watson: 1.611 Prob(Omnibus): 0.000 Jarque-Bera (JB): 36.110 Skew: 1.299 Prob(JB): 1.44e-08 Kurtosis: 7.705 Cond. No. 5.40e+04 ============================================================================== Notes: [1] Standard Errors assume that the covariance matrix of the errors is correctly specified. [2] The condition number is large, 5.4e+04. This might indicate that there are strong multicollinearity or other numerical problems. OLS Regression Results ============================================================================== Dep. Variable: price R-squared: 0.720 Model: OLS Adj. R-squared: 0.688 Method: Least Squares F-statistic: 22.30 Date: Fri, 22 Apr 2022 Prob (F-statistic): 2.33e-07 Time: 14:15:42 Log-Likelihood: -168.43 No. Observations: 30 AIC: 344.9 Df Residuals: 26 BIC: 350.5 Df Model: 3 Covariance Type: nonrobust ============================================================================== coef std err t P>|t| [0.025 0.975] ------------------------------------------------------------------------------ Intercept -21.7176 51.963 -0.418 0.679 -128.529 85.094 lotsize 0.0013 0.001 1.486 0.149 -0.000 0.003 sqrft 0.1170 0.024 4.802 0.000 0.067 0.167 bdrms 25.2012 16.879 1.493 0.147 -9.495 59.897 ============================================================================== Omnibus: 4.958 Durbin-Watson: 1.654 Prob(Omnibus): 0.084 Jarque-Bera (JB): 3.283 Skew: 0.704 Prob(JB): 0.194 Kurtosis: 3.802 Cond. No. 8.78e+04 ============================================================================== Notes: [1] Standard Errors assume that the covariance matrix of the errors is correctly specified. [2] The condition number is large, 8.78e+04. This might indicate that there are strong multicollinearity or other numerical problems. ''' (二)调用statsmodels的函数进行GQ检验从statsmodels库的stats子模块的diagnostic工具中导入het_breuschpagan from statsmodels.stats.diagnostic import het_goldfeldquandt #GQ检验het_goldfeldquandt函数的参数意义及返回结果 het_goldfeldquandt(y, x, idx=None, split=None, drop=None, alternative='increasing', store=False) 参数意义 y: 被解释变量 x:解释变量 idx: int,按第idx个自变量的大小进行排序 split: 如果split为整数,代表选取前、后各split个组;如果split为0到1之间的小数,选取前、后各int(nobs * split)个组 drop:如果drop为整数,去掉中间drop个组;如果split为0到1之间的小数,选取前、后各int(nobs * drop)个组 alternative:备择假设的形式;原假设是同方差性,若alternative分别为"increasing","decreasing", "two-sided"},代表备择假设分别为具有递增型异方差,递减型异方差,复杂异方差。 store: 默认为False,若为True则返回res_store 返回值: fval : F统计量 pval : F统计量对应的p值 ordering : 备择假设的形式;原假设是同方差性,若alternative分别为"increasing","decreasing", "two-sided"},代表备择假设分别为具有递增型异方差,递减型异方差,复杂异方差。 res_store : ResultsStore, 若参数store为True则返回formula='price ~ lotsize +sqrft+bdrms',若数据按照第一个自变量lotsize的大小进行排序,选取前后各30组,去掉中间的28组,且查看分组回归结果,则代码如下: from statsmodels.stats.diagnostic import het_goldfeldquandt #GQ检验 [F,p,order,r]=het_goldfeldquandt(reg.endog,reg.exog,1,30,28,store=True) print("F=",F) print("p=",p) ''' F= 1.658048702954414 p= 0.1020128648382181 '''若我们需要前30组一元线性回归和后30组一元线性回归结果,则输入代码: print(r.resols1.summary()) #第一个分组回归结果 print(r.resols2.summary()) #第二个分组回归结果 ''' OLS Regression Results ============================================================================== Dep. Variable: y R-squared: 0.119 Model: OLS Adj. R-squared: 0.017 Method: Least Squares F-statistic: 1.170 Date: Fri, 22 Apr 2022 Prob (F-statistic): 0.340 Time: 14:17:45 Log-Likelihood: -160.84 No. Observations: 30 AIC: 329.7 Df Residuals: 26 BIC: 335.3 Df Model: 3 Covariance Type: nonrobust ============================================================================== coef std err t P>|t| [0.025 0.975] ------------------------------------------------------------------------------ const 94.3425 100.295 0.941 0.356 -111.817 300.502 x1 0.0098 0.010 0.981 0.336 -0.011 0.030 x2 0.0613 0.033 1.844 0.077 -0.007 0.130 x3 -2.0513 15.173 -0.135 0.894 -33.241 29.138 ============================================================================== Omnibus: 19.188 Durbin-Watson: 1.611 Prob(Omnibus): 0.000 Jarque-Bera (JB): 36.110 Skew: 1.299 Prob(JB): 1.44e-08 Kurtosis: 7.705 Cond. No. 5.40e+04 ============================================================================== Notes: [1] Standard Errors assume that the covariance matrix of the errors is correctly specified. [2] The condition number is large, 5.4e+04. This might indicate that there are strong multicollinearity or other numerical problems. OLS Regression Results ============================================================================== Dep. Variable: y R-squared: 0.720 Model: OLS Adj. R-squared: 0.688 Method: Least Squares F-statistic: 22.30 Date: Fri, 22 Apr 2022 Prob (F-statistic): 2.33e-07 Time: 14:17:45 Log-Likelihood: -168.43 No. Observations: 30 AIC: 344.9 Df Residuals: 26 BIC: 350.5 Df Model: 3 Covariance Type: nonrobust ============================================================================== coef std err t P>|t| [0.025 0.975] ------------------------------------------------------------------------------ const -21.7176 51.963 -0.418 0.679 -128.529 85.094 x1 0.0013 0.001 1.486 0.149 -0.000 0.003 x2 0.1170 0.024 4.802 0.000 0.067 0.167 x3 25.2012 16.879 1.493 0.147 -9.495 59.897 ============================================================================== Omnibus: 4.958 Durbin-Watson: 1.654 Prob(Omnibus): 0.084 Jarque-Bera (JB): 3.283 Skew: 0.704 Prob(JB): 0.194 Kurtosis: 3.802 Cond. No. 8.78e+04 ============================================================================== Notes: [1] Standard Errors assume that the covariance matrix of the errors is correctly specified. [2] The condition number is large, 8.78e+04. This might indicate that there are strong multicollinearity or other numerical problems. '''和我们手动编制函数进行GQ检验的回归结果一致。 |
【本文地址】