在Jupyter Notebook 中输出 HTML |
您所在的位置:网站首页 › jupyter输出 › 在Jupyter Notebook 中输出 HTML |
在Jupyter Notebook 中输出 HTML
|
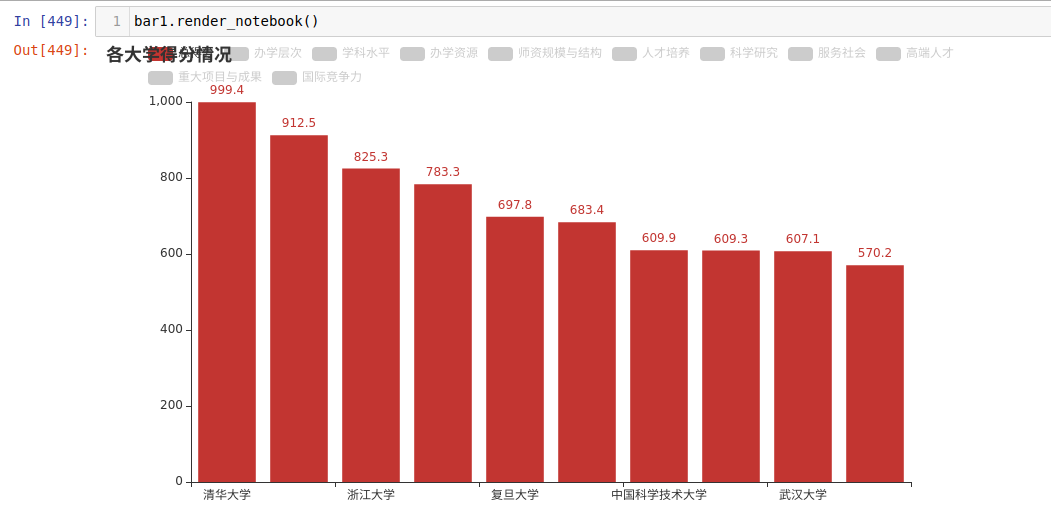
在刚开始使用 Jupyter Notebook 时,我总想使输出结果更使人满意,而不是只把结果打印出来。在我知道可以用 HTML 输出之前,我是这样输出一个表格的(数据来源:软科中国大学排名)。 中国大学排名(主榜) 年份:2022 办 学 办 师资 人 科 服 高 重大 国 总 学 科 学 规模 才 学 务 端 项目 际竞 得 层 水 资 与结 培 研 社 人 与成 争 排名 学校名称 省份 分 次 平 源 构 养 究 会 才 果 力 ---- ------ --- --- --- --- --- --- --- --- --- --- --- --- 1 清华大学 北京 999.4 37.6 73.6 50.0 51.7 334.6 101.3 48.4 89.8 126.8 85.7 2 北京大学 北京 912.5 34.4 73.0 34.5 52.2 322.7 97.7 19.4 91.4 108.1 79.2 3 浙江大学 浙江 825.3 34.1 64.7 34.3 50.0 294.0 103.4 30.5 68.2 89.0 57.0 4 上海交通大学 上海 783.3 35.5 52.9 31.1 47.9 266.8 110.4 32.3 67.3 93.3 45.7 5 复旦大学 上海 697.8 35.9 48.0 23.8 50.2 262.8 87.9 15.3 62.5 61.6 49.6 6 南京大学 江苏 683.4 37.7 48.7 12.5 49.1 279.9 77.7 14.0 58.6 68.0 37.3 7 中国科学技术大学 安徽 609.9 40.0 37.4 16.4 46.6 234.6 75.8 9.4 55.1 41.7 53.0 8 华中科技大学 湖北 609.3 32.3 44.0 14.9 47.8 248.7 83.3 12.1 36.2 49.0 41.1 9 武汉大学 湖北 607.1 32.8 49.0 14.5 48.4 270.6 65.2 12.0 36.6 44.5 33.4 10 西安交通大学 陕西 570.2 34.2 41.0 16.7 47.6 258.8 57.0 19.4 25.9 40.4 29.3输出部分的代码如下: def output(cnt, extended_data): rank_name, year, ind_map, k, univ_data = extended_data output_data = univ_data[:max(0, min(cnt, len(univ_data)))] # 打印表头 print(rank_name, f' 年份:{year}') print(' ' * 19 + ' ' * 9, end='') ik = list(map(lambda o: strB2Q(o.replace('(', '/').replace(')', '').strip()), k)) ip = ['\n 总 ', '\n 得 ', '\n 排名 学校名称 省份 分 ', '\n---- ------ --- --- ', ''] for j in range(4): for i in ik: i_len = len(i) + 1 print(f' {i[j * i_len // 4:(j + 1) * i_len // 4]: ^3} ', end='') print(ip[j], end='') for i in ik: print(f' {"---": ^3} ', end='') print() # 打印数据 for i in output_data: print(f"{i['ranking']:>3} {i['univNameCn']: ^10} {i['province']: >4} {i['score']:>5} ", end='') for j in k: print(f"{i['indData'][ind_map[j]]:>7}", end='') print()这样输出一个表格十分麻烦,要手动调整列宽等,而且输出结果也不十分美观。
但是我不知道有什么办法可以提升输出的质量,直到我使用 PyEcharts 时,我发现 PyEcharts 中的一个 render_notebook() 方法可以把结果用 HTML 的形式输出出来。
上面这行代码输出了下面这些内容: ['__class__', '__delattr__', '__dict__', '__dir__', '__doc__', '__eq__', '__format__', '__ge__', '__getattribute__', '__gt__', '__hash__', '__html__', '__init__', '__init_subclass__', '__le__', '__lt__', '__module__', '__ne__', '__new__', '__reduce__', '__reduce_ex__', '__repr__', '__setattr__', '__sizeof__', '__str__', '__subclasshook__', '__weakref__', '_repr_html_', 'data']我注意到了一个 _repr_html_ 方法,于是我编写了一个测试类,其中声明了一个 _repr_html_方法,然后实例化它: class Test: def _repr_html_(self): return '' Test()果不其然,它正常工作了。下图是它的输出结果。
上面的代码输出结果如下: _ipython_canary_method_should_not_exist_ _ipython_display_ _ipython_canary_method_should_not_exist_ _repr_mimebundle_ _ipython_canary_method_should_not_exist_ _repr_html_ _ipython_canary_method_should_not_exist_ _repr_markdown_ _ipython_canary_method_should_not_exist_ _repr_svg_ _ipython_canary_method_should_not_exist_ _repr_png_ _ipython_canary_method_should_not_exist_ _repr_pdf_ _ipython_canary_method_should_not_exist_ _repr_jpeg_ _ipython_canary_method_should_not_exist_ _repr_latex_ _ipython_canary_method_should_not_exist_ _repr_json_ _ipython_canary_method_should_not_exist_ _repr_javascript_可以看到 Jupyter Notebook 调用了许多方法。除了 repr 开头的方法,还有一个 _ipython_display_ 方法和 一个 _ipython_canary_method_should_not_exist_ 变量。经过测试,如果类中存在 _ipython_canary_method_should_not_exist_,则不会调用以上的这些方法。关于 _ipython_display_ 方法,我没有深入研究过,在此就不展开说明了。 除了 _repr_html_ 之外,_repr_png_ 我也很常用。关于这个方法,其实我最早是在 PIL 库的 Image 对象中发现的。
dir(Image.open(./files.png))可以看到有一个_repr_png_方法。 现在我经常使用 HTML 的方式输出,写了一些输出的工具类,在这里做一个分享: from base64 import b64encode # 自定义输出类,让内容平铺而不是独占一行 class HTML: __class_ind: int = 0 def __init__(self, *df): class_ind = 'c' + str(HTML.__class_ind) HTML.__class_ind += 1 self.html = '.' + class_ind + '>pre,.' + class_ind + \ '>img,.' + class_ind + '>div{display:inline-block;margin-right:20px !important}' if len(df) == 1: df = df[0] for d in df: if hasattr(d, '_repr_html_'): self.html += '' + d._repr_html_() + '' elif hasattr(d, '_repr_png_'): self.html += ').decode() + '/img'
else:
self.html += 'pre' + str(d) + '/pre'
self.html += '/div'
def _repr_html_(self):
return self.html
/code/pre
p效果:br
img src=) [id^=btn_]"),f' + id_ + '=()=>{for(let i of c' + id_ + ')'
'{i.style.display="none"}};f' + id_ + '();for(let i of b' + id_ + '){i.onclick=function(){f' + id_ + '('
');for(let i of b' + id_ + '){i.style.color="#000"}this.style.color="#44f";window["con_"+this.id.substr'
'(4)].style.display="inline"}}b' + id_ + '[0].onclick()'
)
self.__html = switcher + container + java_script
def _repr_html_(self):
return self.__html [id^=btn_]"),f' + id_ + '=()=>{for(let i of c' + id_ + ')'
'{i.style.display="none"}};f' + id_ + '();for(let i of b' + id_ + '){i.onclick=function(){f' + id_ + '('
');for(let i of b' + id_ + '){i.style.color="#000"}this.style.color="#44f";window["con_"+this.id.substr'
'(4)].style.display="inline"}}b' + id_ + '[0].onclick()'
)
self.__html = switcher + container + java_script
def _repr_html_(self):
return self.__html
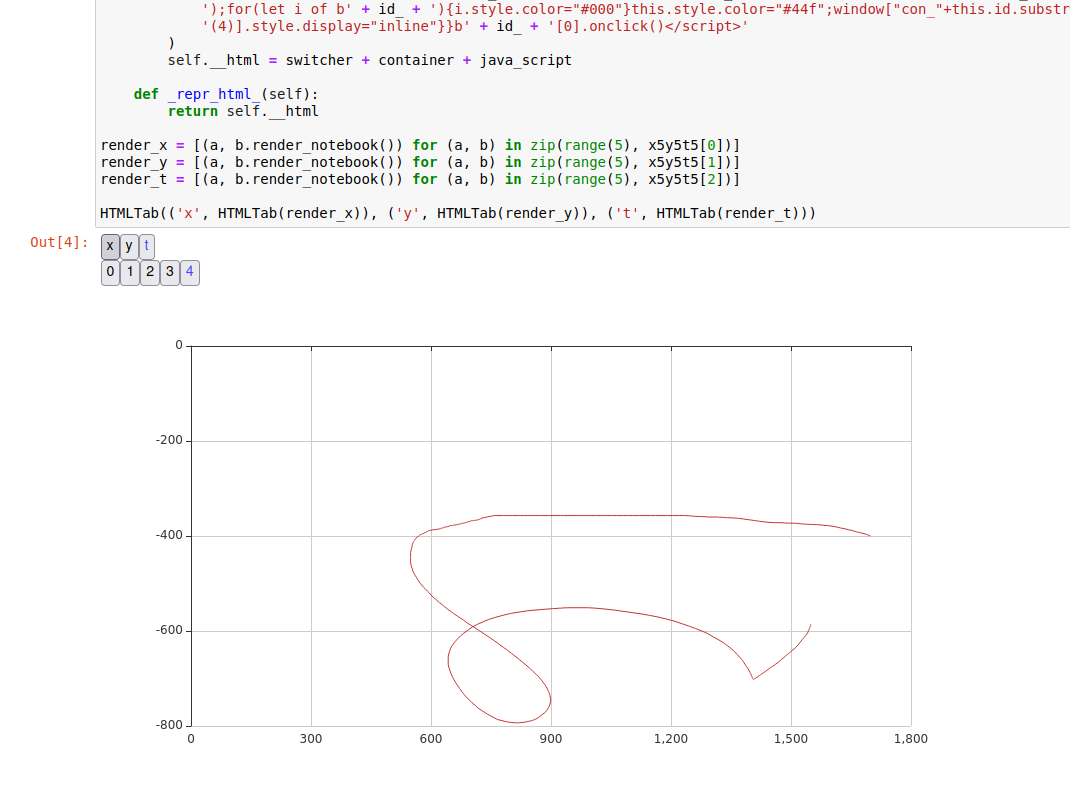
效果:
查看本文来源,作者——light |
 我也想让自己的输出结果更优雅,于是就开始扒拉 PyEcharts 的代码,最后我是用这样的方式知道如何输出 HTML 的:
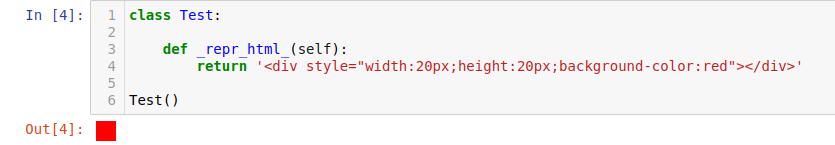 后来我发现不止有 _repr_html_,还有 _repr_png_、_repr_markdown_ 等,用这个方式可以让这类方法们显露无疑:
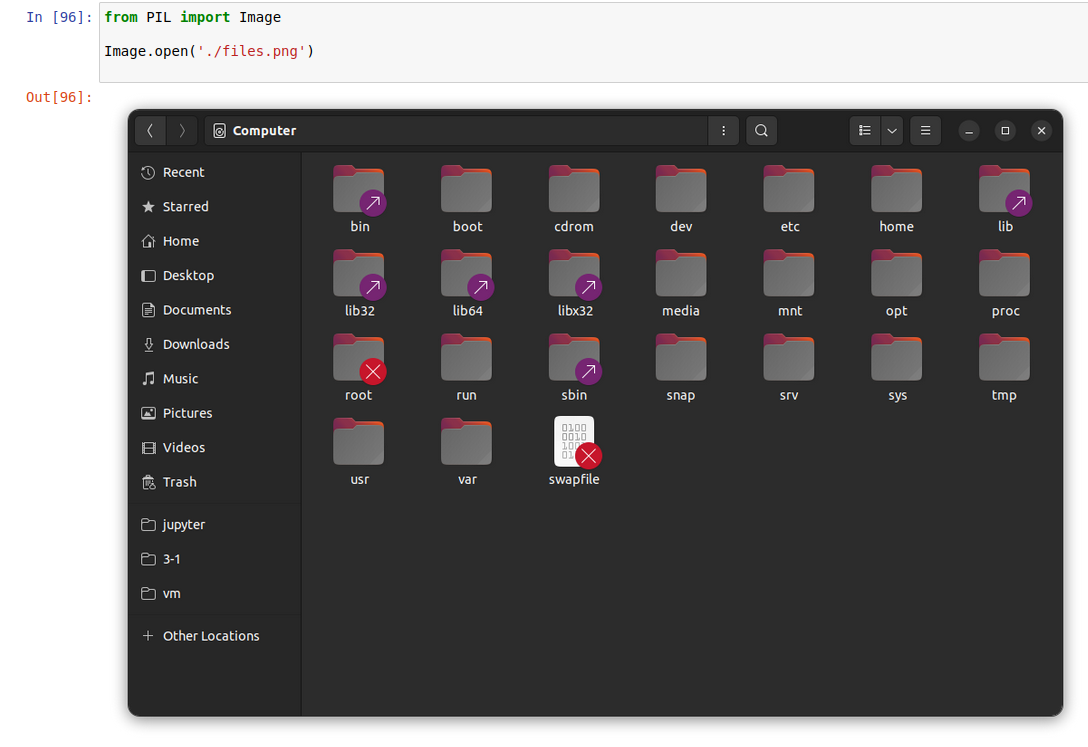
【本文地址】
今日新闻 |
推荐新闻 |