matlab作图,多条曲线画在同一张图上 |
您所在的位置:网站首页 › 如何画方程曲线 › matlab作图,多条曲线画在同一张图上 |
matlab作图,多条曲线画在同一张图上
|
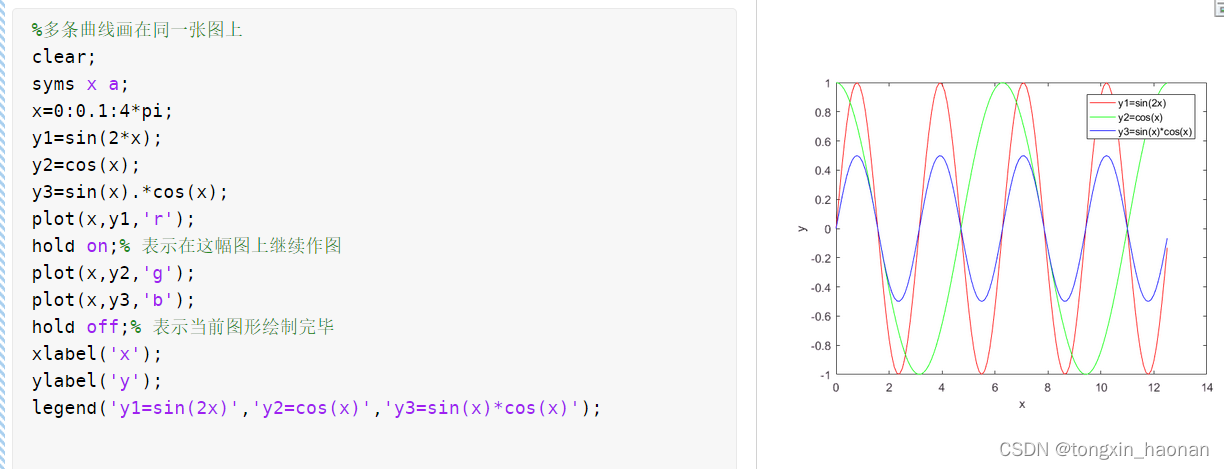
用plot作图时,如何实现多条曲线画在同一张图上呢? -----------------------------------------------------------(●'◡'●)------------------------------------------------------------- 方法一: 使用命令hold on与hold off %多条曲线画在同一张图上 clear; syms x a; x=0:0.1:4*pi; y1=sin(2*x); y2=cos(x); y3=sin(x).*cos(x); plot(x,y1,'r'); hold on;% 表示在这幅图上继续作图 plot(x,y2,'g'); plot(x,y3,'b'); hold off;% 表示当前图形绘制完毕 xlabel('x'); ylabel('y'); legend('y1=sin(2x)','y2=cos(x)','y3=sin(x)*cos(x)');运行结果:
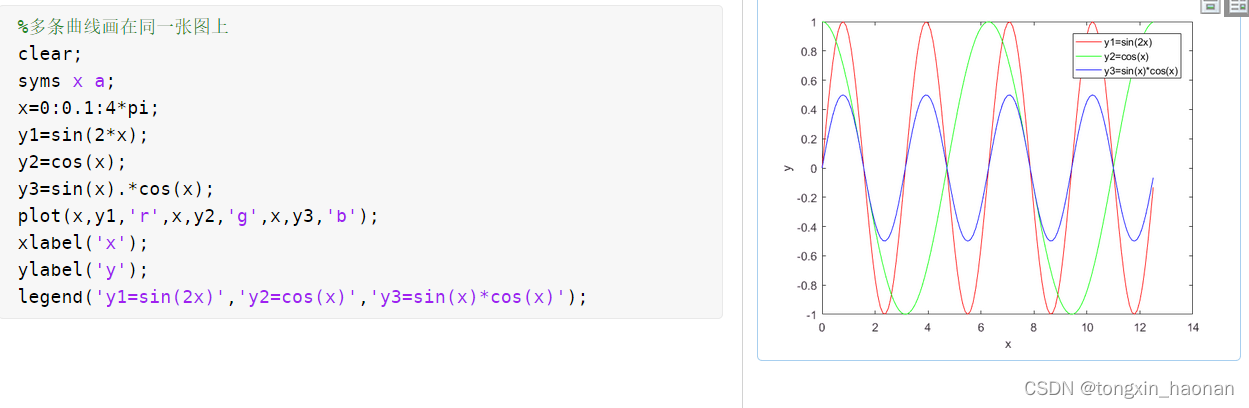
方法二: plot(x,y1,x,y2,x,y3……) %多条曲线画在同一张图上 clear; syms x a; x=0:0.1:4*pi; y1=sin(2*x); y2=cos(x); y3=sin(x).*cos(x); plot(x,y1,'r',x,y2,'g',x,y3,'b'); xlabel('x'); ylabel('y'); legend('y1=sin(2x)','y2=cos(x)','y3=sin(x)*cos(x)');运行结果:
-----------------------------------------------------------(●'◡'●)------------------------------------------------------------- plot有相应的调用格式,或者加个控制命令hold on与hold off就好啦! |
【本文地址】