|
目标效果(连接线与饼图存在间隔): 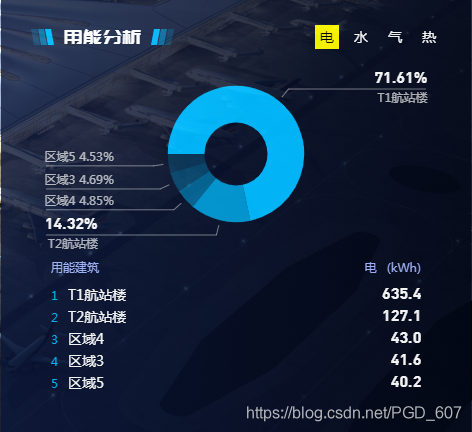
Echarts饼图label配置为outside时,默认连接线与图形直接相连: 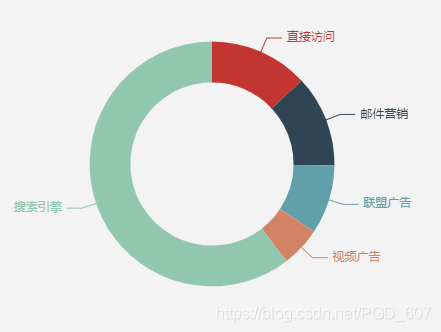 实现方案:绘制时,同时绘制两个半径不同的饼图。一个只显示饼图(半径较小),不显示label;另一个饼图(半径较大),设置为透明,只显示label和连接线。 Echarts series的配置: 实现方案:绘制时,同时绘制两个半径不同的饼图。一个只显示饼图(半径较小),不显示label;另一个饼图(半径较大),设置为透明,只显示label和连接线。 Echarts series的配置:
option.series = [
// 只显示饼图,不显示label和连接线
{
type: 'pie',
startAngle: 180,
minAngle: 15,
radius: ['30%', '65%'],
label: {
show: false,
},
animationTypeUpdate: 'expansion',
animationDurationUpdate: 1000,
data: res.data.series.filter((item) => {
return item.value != 0
})
},
// 饼图设置为透明,只显示label和连接线
{
type: 'pie',
startAngle: 180,
minAngle: 15,
radius: ['65%', '70%'],
avoidLabelOverlap: true,
label: {
position: 'outer',
alignTo: 'edge',
margin: 10,
show: true,
},
labelLine: {
normal: {
length2: 250,
length: 10,
lineStyle: {
color: 'rgba(255, 255, 255, 0.45)'
}
},
},
// 设置为透明
itemStyle: {
opacity: 0,
},
data: res.data.series.filter((item) => {
return item.value != 0
}),
}
]
|