Echarts自定义图形,方法参考 |
您所在的位置:网站首页 › 自定义echarts主题 › Echarts自定义图形,方法参考 |
Echarts自定义图形,方法参考
|
在一个前端大屏项目中,有一个模块使用到了自定义的,由三个面组成的伪3D柱形图。在此处记录一下,方便后续自定义的时候参考一下。涉及到了zrender里面的一些方法,还特意去zrender看了些示例和文档。 1.自定义图形最后的效果是这样的:
图形由三个面组成,需要定义三个形状。用cubeleft,cubetop,cuberight来分别定义左侧面,顶部面以及右侧面。 2.注册自定义的图形 echarts官方文档处:Documentation - Apache ECharts
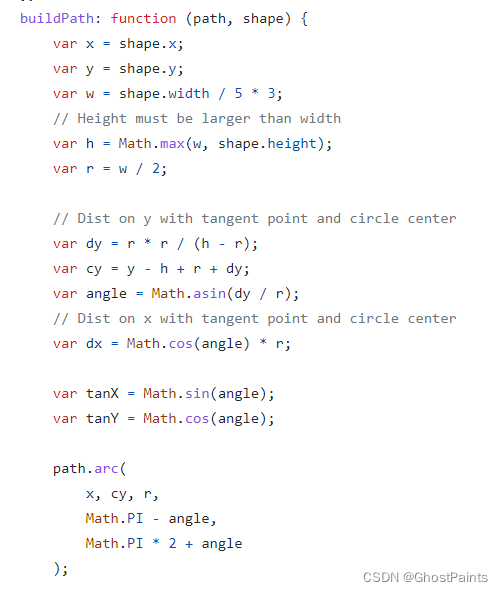
我们需要定义一个这样的类,然后再通过echarts来注册这个类,后续就可以通过类名来使用了。 3.extendShape // 绘制左侧面 const CubeLeft = echarts.graphic.extendShape({ shape: { x: 0, y: 0 }, buildPath: function(ctx, shape) { const xAxisPoint = shape.xAxisPoint const c0 = [shape.x, shape.y] const c1 = [shape.x - 13, shape.y - 13] const c2 = [xAxisPoint[0] - 13, xAxisPoint[1] - 13] const c3 = [xAxisPoint[0], xAxisPoint[1]] ctx.moveTo(c0[0], c0[1]).lineTo(c1[0], c1[1]).lineTo(c2[0], c2[1]).lineTo(c3[0], c3[1]).closePath() } }) // 绘制右侧面 const CubeRight = echarts.graphic.extendShape({ shape: { x: 0, y: 0 }, buildPath: function(ctx, shape) { const xAxisPoint = shape.xAxisPoint const c1 = [shape.x, shape.y] const c2 = [xAxisPoint[0], xAxisPoint[1]] const c3 = [xAxisPoint[0] + 18, xAxisPoint[1] - 9] const c4 = [shape.x + 18, shape.y - 9] ctx.moveTo(c1[0], c1[1]).lineTo(c2[0], c2[1]).lineTo(c3[0], c3[1]).lineTo(c4[0], c4[1]).closePath() } }) // 绘制顶面 const CubeTop = echarts.graphic.extendShape({ shape: { x: 0, y: 0 }, buildPath: function(ctx, shape) { const c1 = [shape.x, shape.y] const c2 = [shape.x + 18, shape.y - 9] const c3 = [shape.x + 5, shape.y - 22] const c4 = [shape.x - 13, shape.y - 13] ctx.moveTo(c1[0], c1[1]).lineTo(c2[0], c2[1]).lineTo(c3[0], c3[1]).lineTo(c4[0], c4[1]).closePath() } })这段代码主要是看buildpath如何使用,zrender的官方文档中,并没有直接告诉这个方法的两个参数是干什么用的,只给了一个示例,从这个示例中,可以知道这两个参数具体怎么用。 示例网址:https://github.com/ecomfe/zrender/blob/master/test/pin.html
第一个参数是path,第二参数是shape。path可以理解为一个canvas中的绘制画笔,可以设置路径并且闭合路径。 第二个参数在echarts中,是自定义的custom传递过来的,因此可以通过这个对象获取到我们一个很熟悉的属性 xAxisPoint。 绘制的两个面中,只有左侧和右侧面需要有填充高度,顶部不需要,所以顶部的形状就没有使用xAxisPoint这个属性。 这也是很好理解的,因为我们自定义的伪圆柱体里面的填充物肯定是有一个高度的。填充多少根据我们的数据来知道,让它看起来确实是被某种东西从底部开始增多填充了。 拿比较简单的顶部来举例: buildPath: function(ctx, shape) { const c1 = [shape.x, shape.y] const c2 = [shape.x + 18, shape.y - 9] const c3 = [shape.x + 5, shape.y - 22] const c4 = [shape.x - 13, shape.y - 13] ctx.moveTo(c1[0], c1[1]).lineTo(c2[0], c2[1]).lineTo(c3[0], c3[1]).lineTo(c4[0],c4[1]).closePath() }绘制的四边形,其实就是四个顶点,我们只需要用moveTo来控制路径就行,在最后那个点进行闭合就行。偏移量是固定的值,可以根据情况自己去设置不同的值来扭曲这个四边形。 其中c1是底部的顶点,c2是右侧的顶点,c3是顶部的顶点,c4是右侧的顶点。其他两个面也是类似的。 4.使用echarts注册这三个图形 // 注册三个面图形 echarts.graphic.registerShape('CubeLeft', CubeLeft) echarts.graphic.registerShape('CubeRight', CubeRight) echarts.graphic.registerShape('CubeTop', CubeTop)5.使用自定义的形状 其他的数据都和正常使用echarts一样,不同的地方在于series的配置。 series数组中,总共放置二个对象。第一个对象如下: { type: 'custom', renderItem: function(params, api) { const location = api.coord([api.value(0), api.value(1)]) return { type: 'group', children: [{ type: 'CubeLeft', shape: { api, x: location[0], y: location[1], xAxisPoint: api.coord([api.value(0), 0]) }, style: { fill: 'rgba(47,102,192,.27)', stroke: 'black' }, z2: 999 }, { type: 'CubeRight', shape: { api, x: location[0], y: location[1], xAxisPoint: api.coord([api.value(0), 0]) }, style: { fill: 'rgba(59,128,226,.27)', stroke: 'black' }, z2: 999 }, { type: 'CubeTop', shape: { api, x: location[0], y: location[1], xAxisPoint: api.coord([api.value(0), 0]) }, style: { fill: 'rgba(72,156,221,.27)', stroke: 'black' }, z2: 999 }] } }, data: MAX }最主要的还是renderItem里面的逻辑,这个方法返回一个对象,对象就是我们自定义的一个group组。renderItem可以返回的对象在文档中都有说明:Documentation - Apache ECharts 我们定义的那三个面,需要把它看成一个整体,所以renderItem返回的是一个类型为group的对象,另外三个形状作为children保存在数组中。 其中的shape参数,会在buildpath中使用到。 style中设置了它的填充颜色和边框线颜色。然后使用z2定义这个echarts的显示层级为最上级。如果不使用它,下面用于填充的会将其遮挡住。 这里也只是定义了第一个自定义的形状,也就是最外层的那个伪3d柱体。第二个自定义形状是要填充的形状。 { type: 'custom', renderItem: (params, api) => { const location = api.coord([api.value(0), api.value(1)]) var color = new echarts.graphic.LinearGradient( 0, 0, 0, 1, [{ offset: 1, color: "#FEFD53" }, { offset: 0, color: "#f7c824" } ] ); return { type: 'group', children: [{ type: 'CubeLeft', shape: { api, xValue: api.value(0), yValue: api.value(1), x: location[0], y: location[1], xAxisPoint: api.coord([api.value(0), 0]) }, style: { fill: color, stroke: 'red' } }, { type: 'CubeRight', shape: { api, xValue: api.value(0), yValue: api.value(1), x: location[0], y: location[1], xAxisPoint: api.coord([api.value(0), 0]) }, style: { fill: color, stroke: 'red' } }, { type: 'CubeTop', shape: { api, xValue: api.value(0), yValue: api.value(1), x: location[0], y: location[1], xAxisPoint: api.coord([api.value(0), 0]) }, style: { fill: color, stroke: 'red' } }] } }, data: VALUE }内部填充的图形,使用了一个线性渐变的颜色用来填充。边框线使用红色。与第一个不同的是,style里面的风格,以及data使用的数据。这里的data使用value具体的数值。而外壳的图形使用的数据是max最大值。这样就会有一个渐变颜色填充的红色边框图形,填充到了一个黑色边框的柱体中。 这样就自定义好了一个视觉上的3d柱体形状的图表了。 |


【本文地址】
今日新闻 |
推荐新闻 |