MATLAB有趣或有用小程序合集 |
您所在的位置:网站首页 › 脚本例子搞笑 › MATLAB有趣或有用小程序合集 |
MATLAB有趣或有用小程序合集
|
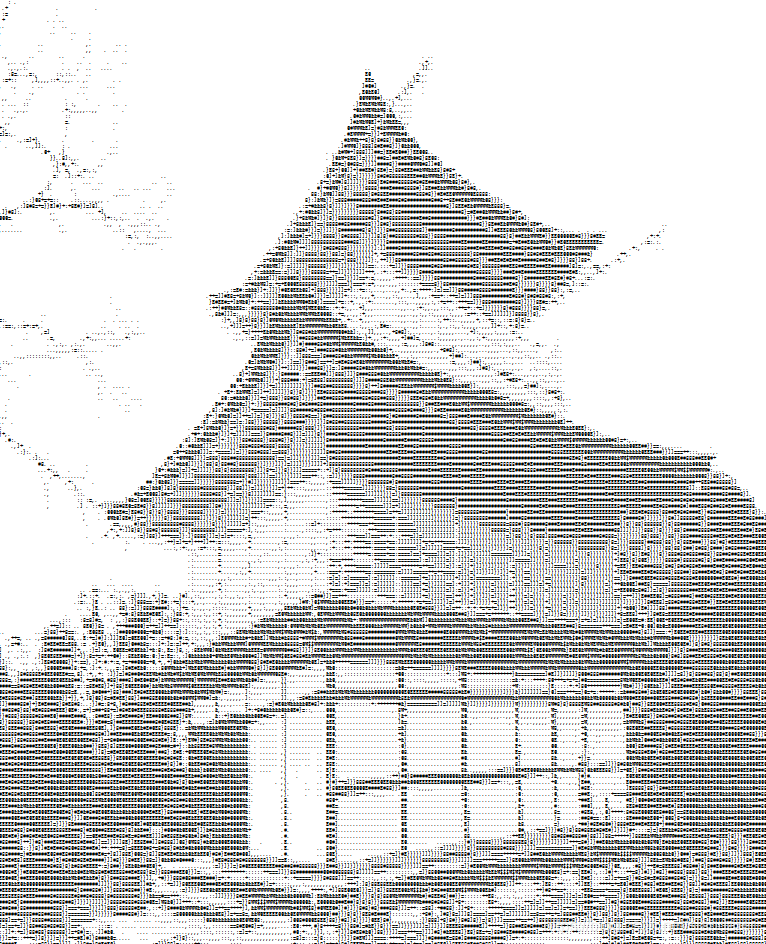
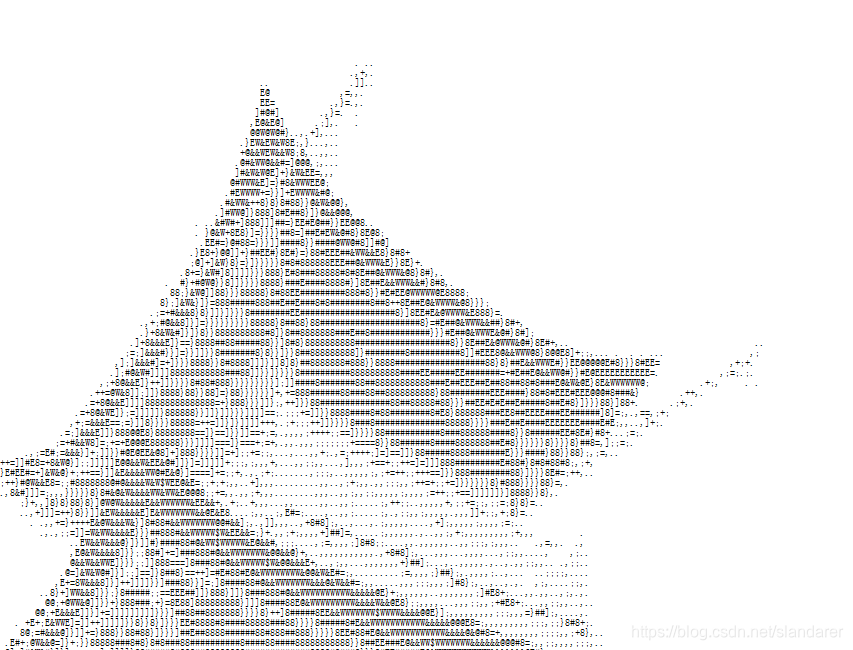
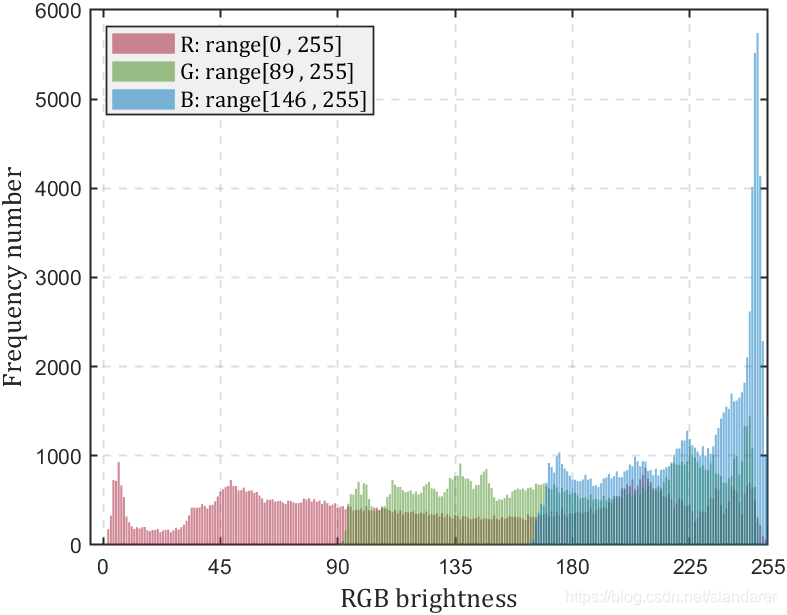
最近编辑时间:2021-5-11 这是一些比较有趣,但是感觉不值得单独发文章的小程序合集: 不定时更新,大家可以闲的没事来淘个宝 这里写目录标题 1.字幕画2.鱼形曲线3.鼠标沙盘4.地图寻路演示5.樱花树6.字符画7.you need MATLAB8.图片各通道亮度频数直方图 1.字幕画
drawCaption.m function drawCaption(string) if nargin=1&&tailPnt(1)+Dir(i,1)=1&&tailPnt(2)+Dir(i,2)9; if i==1,I=~1;end L1=T(:,I);t=L1(3,:);R1=L1+[cos(t-a)*L;sin(t-a)*L;t*0-a];R2=L1+[cos(t+a)*L;sin(t+a)*L;t*0+a]; L2=T(:,~I);t=L2(3,:);R3=L2+[cos(t)*L;sin(t)*L;t*0]; T=[R1,R2,R3]; X=[L1(1,:),L1(1,:),L2(1,:);R1(1,:),R2(1,:),R3(1,:)];X(end+1,:)=nan; Y=[L1(2,:),L1(2,:),L2(2,:);R1(2,:),R2(2,:),R3(2,:)];Y(end+1,:)=nan; plot(X(:),Y(:),'Color',[0 0 0]+i*.3/16,'LineWidth',5*0.8^i) if i>14,scatter(T(1,:),T(2,:),i*2-20,'CData',[.86,.68,.68]/(1-.13*(i-15)));end end三年前学matlab没多久的代码 function sakura hold on,axis equal axis(0.5+[-10,50,0,50]) set(gca,'xtick',[],'ytick',[],'xcolor','w','ycolor','w') set(gca,'color',[0.5020 0.5020 0.5020]) length_trunk=6; width_trunk=4; k1=0.9; k2=0.8; number_branch=15; alp=pi/10; length_branch=k1*length_trunk; width_branch=k2*width_trunk; trunk=[12,0;12,length_trunk]; plot(trunk(:,1),trunk(:,2),'color',[0 0 0],'Linewidth',width_trunk) begins=[trunk(2,:),pi/2,1]; grow=begins; plotdata=[0 0 0 0 0 0 0 0]; plotdata(1,:)=[]; for i=1:number_branch control=randi(25,[length(grow(:,1)),1])>=10; ag=grow(:,3); l=length(ag); parta=[length_branch.*k1.^grow(:,4).*cos(ag+ones(l,1)*alp),length_branch.*k1.^grow(:,4).*sin(ag+ones(l,1)*alp),ones(l,1)*alp,ones(l,1)]; partb=[length_branch.*k1.^grow(:,4).*cos(ag-ones(l,1)*alp),length_branch.*k1.^grow(:,4).*sin(ag-ones(l,1)*alp),-ones(l,1)*alp,ones(l,1)]; parta2=[0.8.*length_branch.*k1.^grow(:,4).*cos(ag),0.8.*length_branch.*k1.^grow(:,4).*sin(ag),zeros(l,1),ones(l,1)]; partb2=[0.8.*length_branch.*k1.^grow(:,4).*cos(ag),0.8.*length_branch.*k1.^grow(:,4).*sin(ag),zeros(l,1),ones(l,1)]; parta=control.*parta+(~control).*parta2; partb=control.*partb+(~control).*partb2; parta=parta+grow; partb=partb+grow; congress=[parta;partb]; grow=[grow;grow]; judge=[grow,congress]; judge=unique(judge,'rows'); grow=judge(:,5:end); plotdata=[plotdata;judge]; end for i=1:number_branch temp_w=width_branch*0.8^i; temp_branch=plotdata(plotdata(:,4)==i,:); plx=[temp_branch(:,1),temp_branch(:,5)]; ply=[temp_branch(:,2),temp_branch(:,6)]; plx=plx';ply=ply'; plot(plx,ply,'color',[0 0 0]+i*[0.3020 0.3020 0.3020]./number_branch,'Linewidth',temp_w) end bloom_pos=plotdata(plotdata(:,8)==number_branch+1,[5,6]); scatter(bloom_pos(:,1),bloom_pos(:,2),10,'CData',[0.8549 0.6824 0.6824]) bloom_pos=plotdata(plotdata(:,8)==number_branch,[5,6]); scatter(bloom_pos(:,1),bloom_pos(:,2),8,'CData',[0.7451 0.5961 0.5961].*0.97) end 6.字符画将图像转为字符画并存到test.txt内 为了显示全可将txt内文本字体大小调小 由于字间距问题图像会被略微拉长 上下俩写法效果一样的: 彩图直方图绘制效果: 代码: 使用的时候改变imread中的图片文件路径即可 function HistogramPic pic=imread('test.jpg'); %pic=rgb2gray(pic); FreqNum=zeros(size(pic,3),256); for i=1:size(pic,3) for j=0:255 FreqNum(i,j+1)=sum(sum(pic(:,:,i)==j)); end end ax=gca; hold(ax,'on') if size(FreqNum,1)==3 rBar=bar(0:255,FreqNum(1,:)); gBar=bar(0:255,FreqNum(2,:)); bBar=bar(0:255,FreqNum(3,:)); rBar.FaceColor=[0.6350 0.0780 0.1840]; gBar.FaceColor=[0.2400 0.5300 0.0900]; bBar.FaceColor=[0 0.4470 0.7410]; rBar.FaceAlpha=0.5; gBar.FaceAlpha=0.5; bBar.FaceAlpha=0.5; ax.XLabel.String='RGB brightness'; rrange=find(FreqNum(1,:)~=0); rrange=[num2str(rrange(1)-1),' , ',num2str(rrange(end)-1)]; grange=find(FreqNum(2,:)~=0); grange=[num2str(grange(1)-1),' , ',num2str(grange(end)-1)]; brange=find(FreqNum(3,:)~=0); brange=[num2str(brange(1)-1),' , ',num2str(brange(end)-1)]; legend({['R: range[',rrange,']'],... ['G: range[',grange,']'],... ['B: range[',brange,']']},... 'Location','northwest','Color',[0.9412 0.9412 0.9412],... 'FontName','Cambria','LineWidth',0.8,'FontSize',11); else kBar=bar(0:255,FreqNum(1,:)); kBar.FaceColor=[0.50 0.50 0.50]; kBar.FaceAlpha=0.5; ax.XLabel.String='Gray scale'; krange=find(FreqNum(1,:)~=0); krange=[num2str(krange(1)-1),' , ',num2str(krange(end)-1)]; legend(['Gray: range[',krange,']'],... 'Location','northwest','Color',[0.9412 0.9412 0.9412],... 'FontName','Cambria','LineWidth',0.8,'FontSize',11); end box on grid on ax.LineWidth = 1; ax.GridLineStyle='--'; ax.XLim=[-5 255]; ax.XTick=[0:45:255,255]; ax.XLabel.FontSize=13; ax.XLabel.FontName='Cambria'; ax.YLabel.String='Frequency number'; ax.YLabel.FontSize=13; ax.YLabel.FontName='Cambria'; end |
 动图:
动图: 代码分为两个m文件 直接运行drawCaption或命令行打出 drawCaption(‘想发的文字’)即可
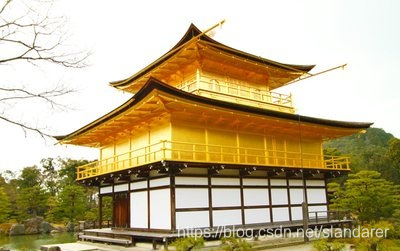

 灰度图直方图绘制效果:
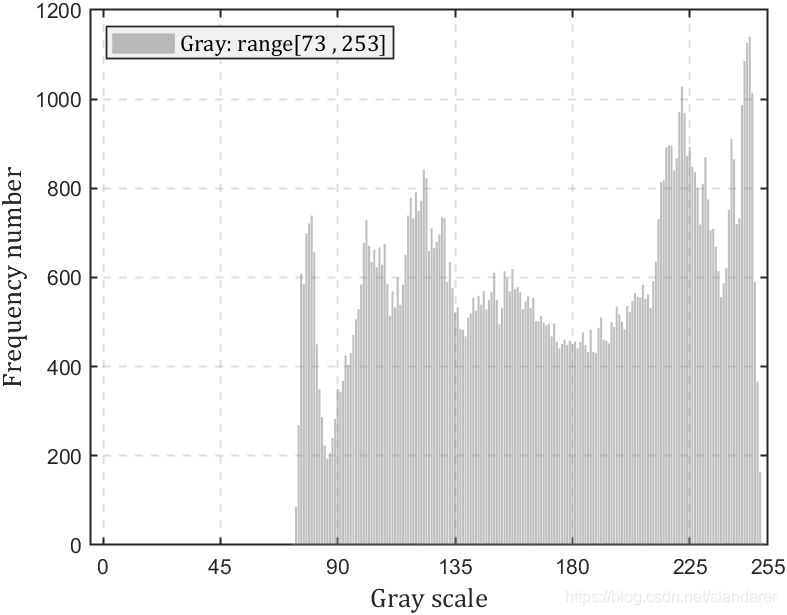
【本文地址】