Matplotlib绘制函数的等高线与三维图像 |
您所在的位置:网站首页 › 等高线立体图形 › Matplotlib绘制函数的等高线与三维图像 |
Matplotlib绘制函数的等高线与三维图像
|
文章目录
前言1. 网格点2. 等高线3. 三维图像
前言
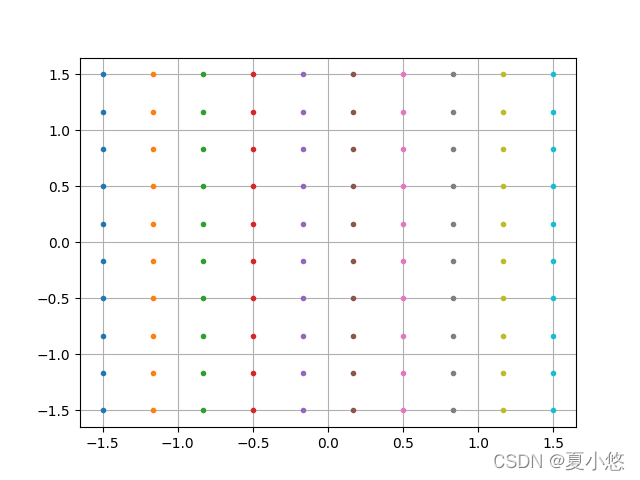
本篇文章记录一下函数的等高线及其三维图像的可视化方法。本例绘制的函数为 f ( x , y ) = x e − ( x 2 + y 2 ) f(x,y)=x e^{-(x^2+y^2)} f(x,y)=xe−(x2+y2) 1. 网格点在绘制曲线之前,先了解一下网格点的绘制。比如绘制一个3x3的网格,那么就需要9个坐标点: (0,2)-----(1,2)-----(2,2) (0,1)-----(1,1)-----(2,1) (0,0)-----(1,0)-----(2,0)将其x轴和y轴坐标分开表示: # x轴: [[0, 1, 2], [0, 1, 2], [0, 1, 2]] # y轴: [[0, 0, 0], [1, 1, 1], [2, 2, 2]]在numpy中可以使用np.meshgrid()来生成网格点: import numpy as np import matplotlib.pyplot as plt # 10x10 x = np.linspace(-1.5, 1.5, num=10) y = np.linspace(-1.5, 1.5, num=10) # generate grid X, Y = np.meshgrid(x, y) plt.plot(X, Y, marker='.', linestyle='') plt.grid(True) plt.show()
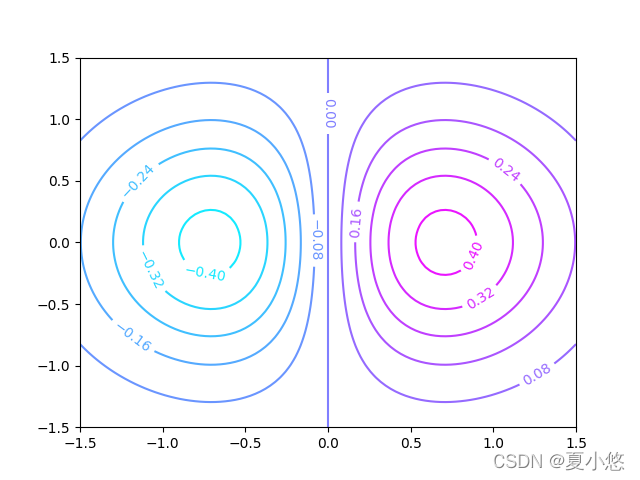
绘制等高线需要的数据有点的坐标位置(x, y)以及坐标的高度z,高度z就是将坐标点(x, y)带入函数 f ( x , y ) f(x, y) f(x,y)中计算得到的,在matplotlib中可以使用plt.contour()来绘制: import numpy as np import matplotlib.pyplot as plt x = np.linspace(-1.5, 1.5, num=100) y = np.linspace(-1.5, 1.5, num=100) X, Y = np.meshgrid(x, y) f = X * np.exp(-X**2 - Y**2) fig = plt.figure() plt.xlim(-1.5, 1.5) plt.ylim(-1.5, 1.5) # draw ax = plt.contour(X, Y, f, levels=10, cmap=plt.cm.cool) # add label plt.clabel(ax, inline=True) # plt.savefig('img1.png') plt.show()
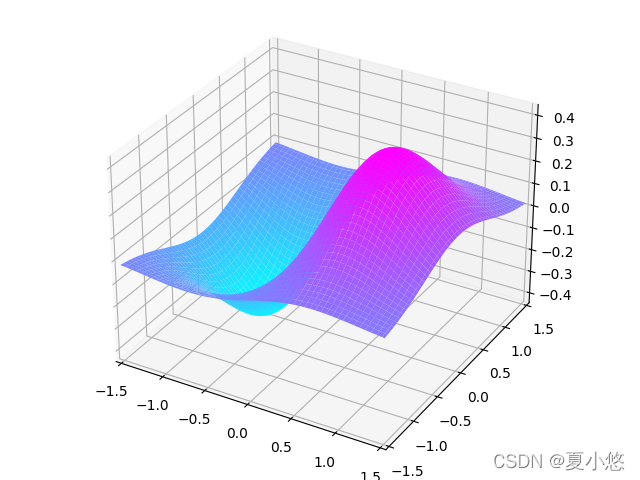
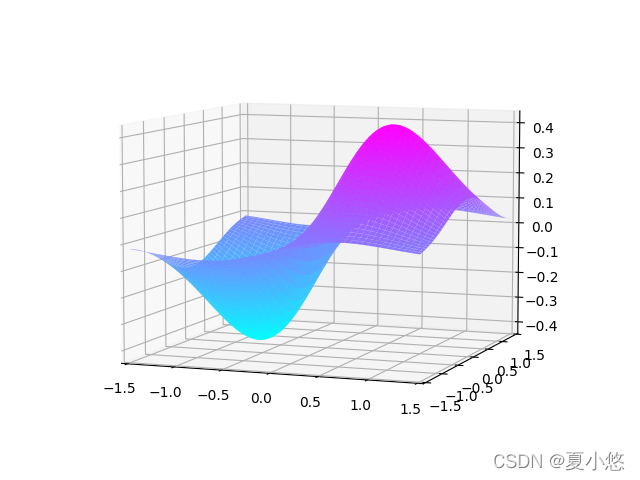
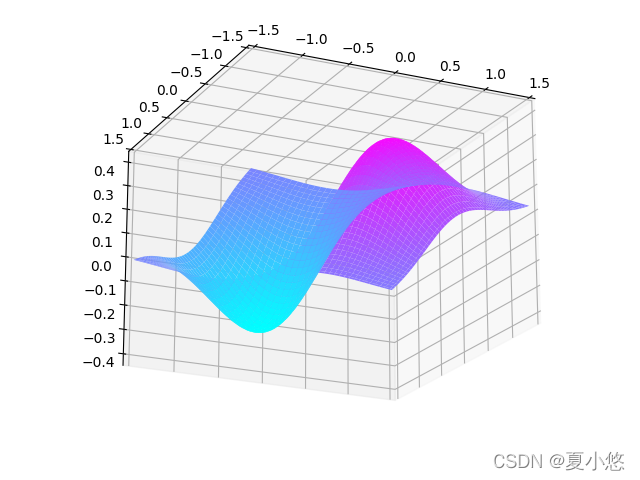
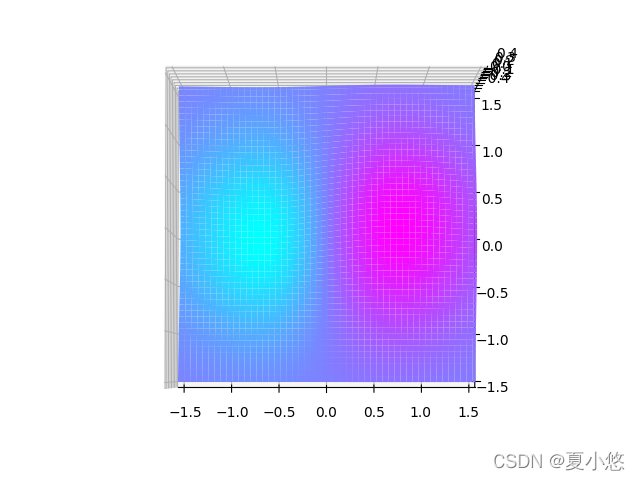
更多的api参数请参考官方文档。 3. 三维图像函数的三维图像的绘制需要的数据与等高线一样,即坐标位置(x, y)以及坐标的高度z,在matplotlib中可以使用mpl_toolkits.mplot3d来绘制: import numpy as np import matplotlib.pyplot as plt from mpl_toolkits.mplot3d import Axes3D x = np.linspace(-1.5, 1.5, num=100) y = np.linspace(-1.5, 1.5, num=100) X, Y = np.meshgrid(x, y) f = X * np.exp(-X**2 - Y**2) fig = plt.figure() ax = Axes3D(fig) # ax.set_xlabel('X') # ax.set_ylabel('Y') # ax.set_zlabel('Z') plt.xlim(-1.5, 1.5) plt.ylim(-1.5, 1.5) ax.plot_surface(X, Y, f, cmap=plt.cm.cool) # plt.savefig('img1.png') plt.show()
有关mpl_toolkits.mplot3d的使用可以参考官方文档; 更多的颜色搭配可参考matplotlib的colormap官方手册。 |

【本文地址】