Mermaid+GPT:秒出流程图和代码设计思路 |
您所在的位置:网站首页 › 程序编写流程图 › Mermaid+GPT:秒出流程图和代码设计思路 |
Mermaid+GPT:秒出流程图和代码设计思路
|
太长不看:本文将介绍如何将程序需求自动变成容易修改的流程图,使用的工具是Copilot和Markdown,下面是我得到的一个结果:  Image Image我提出的prompt是: Given the following requirements, create mermaid diagram code that shows the relationship, use classDiagram and others in mermaid. Requirments: [Discription of the needOmmited for brevity]以下是全文: Mermaid的使用非常简单,在你喜欢的markdown浏览器插件里搜索Mermaid安装即可,能够做到Markdown的所见即所得,无需LaTeX复杂的语法和Exhaustive的配置、编译。 (下面是一开始用英文写的,凑合看) Mermaid is a JavaScript library that allows you to create diagrams in Markdown. It is based on the Graphviz library, which is a graph visualization tool. Why Mermaid?In LaTeX, we can create diagrams using the TikZ package. But the syntax is not very intuitive and it is not easy to create complex diagrams. \documentclass{article} \usepackage{tikz} \usetikzlibrary{positioning} \begin{document} \begin{tikzpicture}[ roundnode/.style={circle, draw=green!60, fill=green!5, very thick, minimum size=7mm}, squarednode/.style={rectangle, draw=red!60, fill=red!5, very thick, minimum size=5mm}, ] %Nodes \node[squarednode] (maintopic) {2}; \node[roundnode] (uppercircle) [above=of maintopic] {1}; \node[squarednode] (rightsquare) [right=of maintopic] {3}; \node[roundnode] (lowercircle) [below=of maintopic] {4}; %Lines \draw[->] (uppercircle.south) -- (maintopic.north); \draw[->] (maintopic.east) -- (rightsquare.west); \draw[->] (rightsquare.south) .. controls +(down:7mm) and +(right:7mm) .. (lowercircle.east); \end{tikzpicture} \end{document} Image ImageUsing Mermaid, we can create the same diagram in Markdown: graph LR A((1)) --> B[2] B --> C[3] C --> D((4)) style A fill:#f9f,stroke:#333,stroke-width:4px style B fill:#bbf,stroke:#f66,stroke-width:2px,color:#fff style C fill:#ff9,stroke:#333 style D fill:#9f9,stroke:#333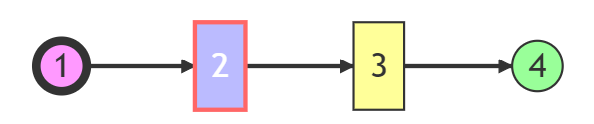 Image ImageNow if we want to keep 1, 2, 4 in one line and move 3 to the right, and also connect (1,2), (2,3), (3,4), we can use the subgraph keyword: graph TB subgraph Z direction TB A((1)) --> B[2] D((4)) end subgraph ZA direction RL C[3] end B-->C C-->D style A fill:#9f9,stroke:#f66,stroke-width:4px style B fill:#bbf,stroke:#f66,stroke-width:2px,color:#fff style C fill:#bbf,stroke:#f66,stroke-width:2px,color:#fff style D fill:#9f9,stroke:#f66,stroke-width:4px ImageUse Case: Function Signature Design Diagram ImageUse Case: Function Signature Design DiagramSay if I have some functions with params:type and return type, I can use Mermaid to create a diagram to show the relationship between them. We can use the classDiagram to create a more complex diagram: classDiagram class A{ +int x +int y +void foo() } class B{ +int x +int y +void foo() } class C{ +int x +int y +void foo() } A ImageThis code is in fact generated by GPT Given the requirments above. And it's QUITE accurate. 文章中英混杂,懒得改了,下次再说。本文使用 Zhihu On VSCode 创作并发布 |
【本文地址】