Plotly+Seaborn+Folium可视化探索爱彼迎租房数据 |
您所在的位置:网站首页 › 爱彼迎优惠价 › Plotly+Seaborn+Folium可视化探索爱彼迎租房数据 |
Plotly+Seaborn+Folium可视化探索爱彼迎租房数据
|
Airbnb是AirBed and Breakfast ( “Air-b-n-b” )的缩写,中文名称之为:空中食宿,是一家联系旅游人士和家有空房出租的服务型网站,可以为用户提供各式各样的住宿信息。 本文针对kaggle上爱彼迎在新加坡的一份数据进行探索分析。原notebook学习地址:https://www.kaggle.com/bavalpreet26/singapore-airbnb/notebook 
爱彼迎将全球的租房数据进行了收集,并且放在了自己的官网上供参考,官方数据地址:http://insideairbnb.com/get-the-data.html 上面很多城市的数据,国内的有北京、上海等,都是免费可下载的,感兴趣的朋友可以玩转这些数据。 本文选择的是花园城市-狮城新加坡,是个出国旅游的好去处! 
本文相关数据集和代码大家可以直接在Kaggle官网下载。 导入库导入数据分析需要的库: import pandas as pd import numpy as np# 二维图形 import matplotlib import matplotlib.pyplot as plt import seaborn as sns import geopandas as gpd plt.style.use('fivethirtyeight') %matplotlib inline# 动态图 import plotly as plotly import plotly.express as px import plotly.graph_objects as go from plotly.offline import init_notebook_mode, iplot, plot init_notebook_mode(connected=True)# 地图制作 import folium import folium.plugins# NLP:词云图 import wordcloud from wordcloud import WordCloud, STOPWORDS, ImageColorGenerator# 机器学习建模相关 import sklearn from sklearn import preprocessing from sklearn import metrics from sklearn.metrics import r2_score, mean_absolute_error from sklearn.preprocessing import LabelEncoder,OneHotEncoder from sklearn.model_selection import train_test_split from sklearn.linear_model import LinearRegression,LogisticRegression from sklearn.ensemble import RandomForestRegressor, GradientBoostingRegressor# 忽略告警 import warnings warnings.filterwarnings("ignore") 数据基本信息导入我们获取到的数据: 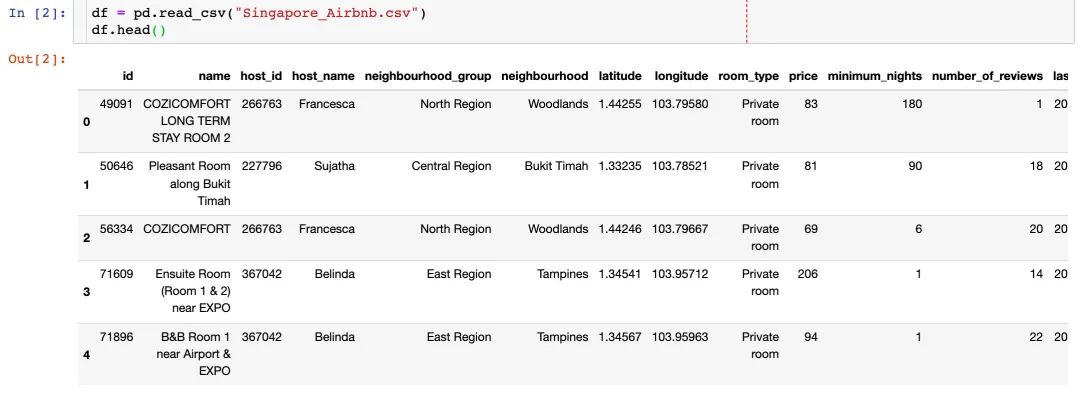
查看数据的基本信息:形状shape、字段、缺失值等 # 数据形状 df.shape(7907, 16)# 字段信息 columns = df.columns columnsIndex(['id', 'name', 'host_id', 'host_name', 'neighbourhood_group','neighbourhood', 'latitude', 'longitude', 'room_type', 'price','minimum_nights', 'number_of_reviews', 'last_review','reviews_per_month', 'calculated_host_listings_count','availability_365'],dtype='object')具体解释下每个字段的中文含义为: id:记录ID name:房屋名字 host_id:房东id host_name:房东名字 neighbourhood:区域 latitude:纬度 longitude:经度 room_type:房间类型 price:价格 minimum_nights:预订最低天数 number_of_reviews:评论数量 last_reviews:最近一次评论时间 reviews_per_month:评论数/月 calculated_host_listings_count:房东拥有的可出租房屋数量 availability_365:房屋一年内可租天数 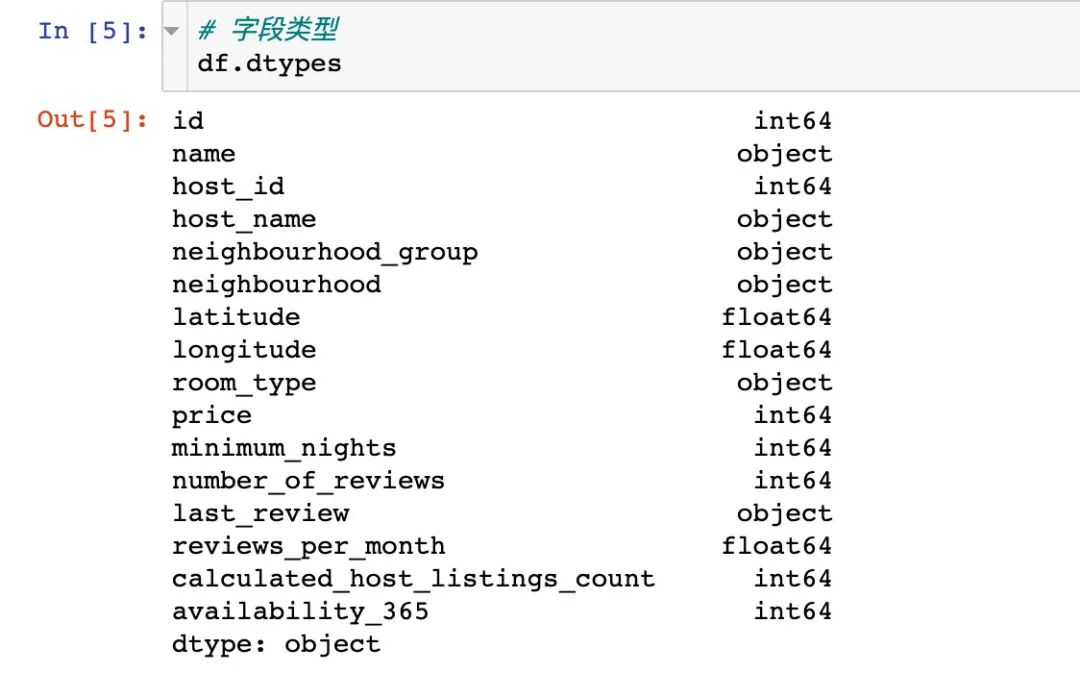
通过DataFrame的info属性我们能够查看数据的多个信息: 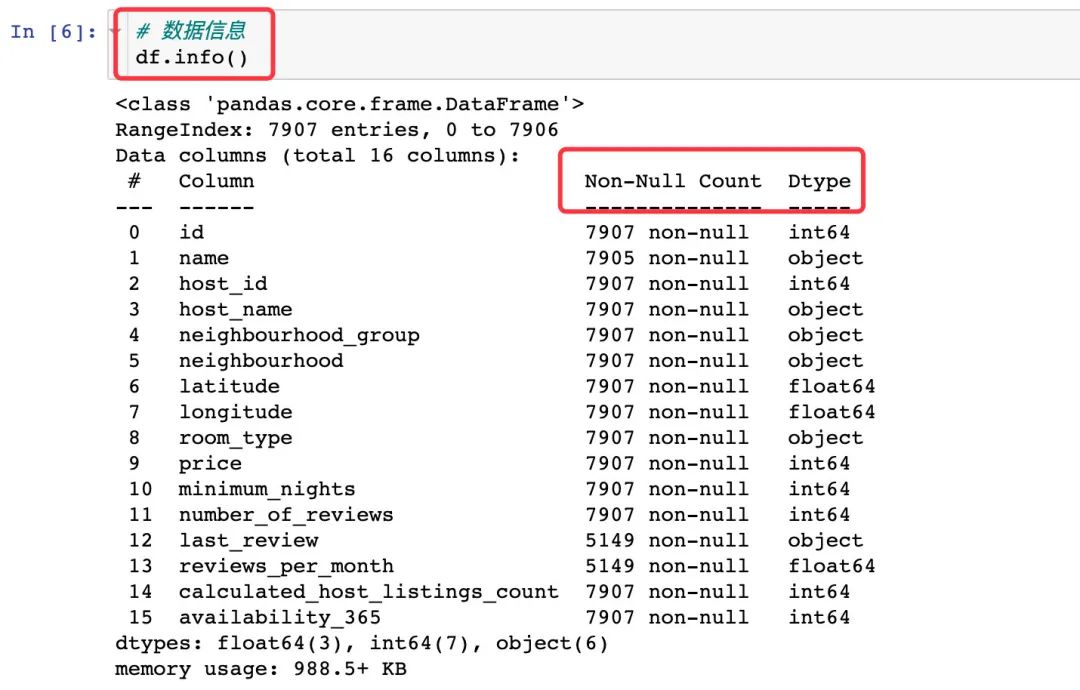
具体的缺失值情况: 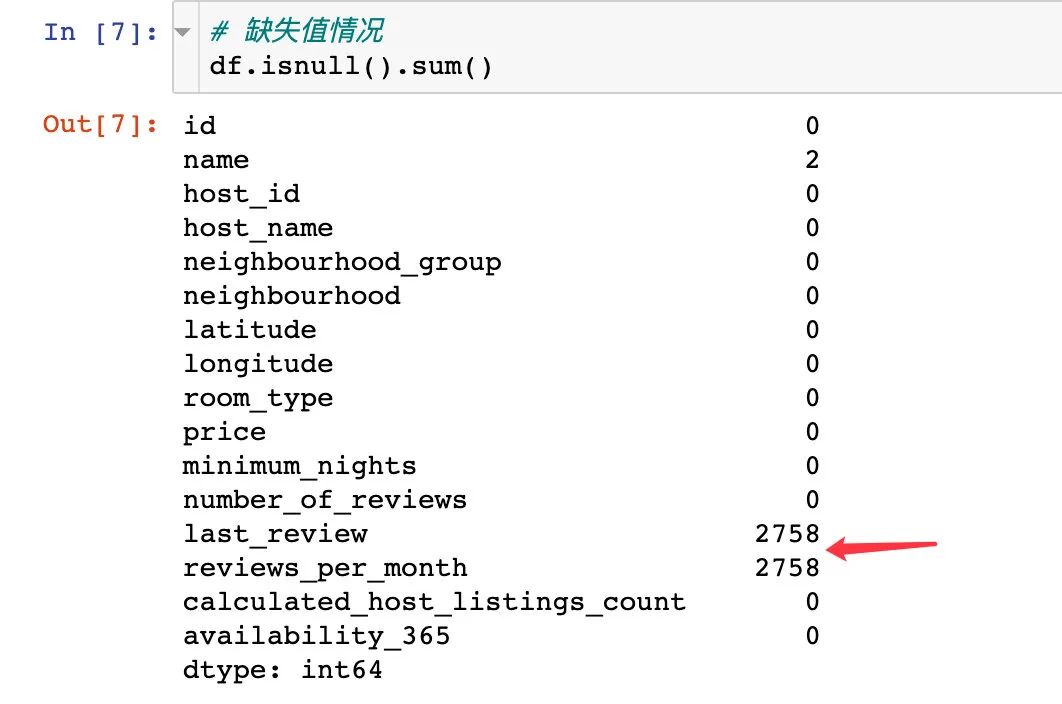 缺失值处理
缺失值处理
1、先查看字段的缺失值分布情况:从下面的图形中看出来也是last_review和reviews_per_month字段存在缺失值 sns.set(rc={'figure.figsize':(19.7, 8.27)}) sns.heatmap(df.isnull(),yticklabels=False,cbar=False,cmap='viridis' )plt.show()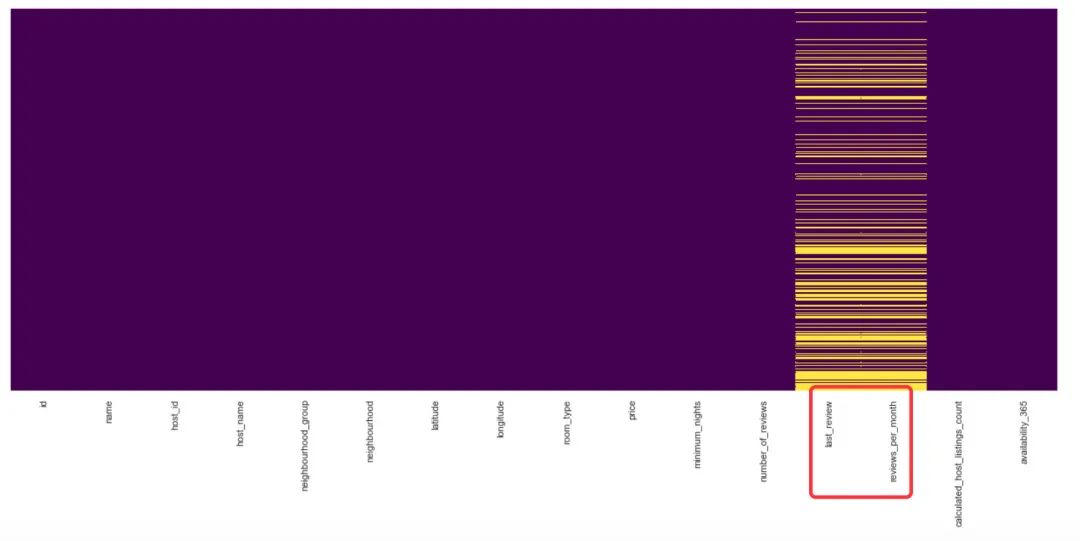
2、缺失值的字段(上面的两个)和name字段的两行记录直接删除 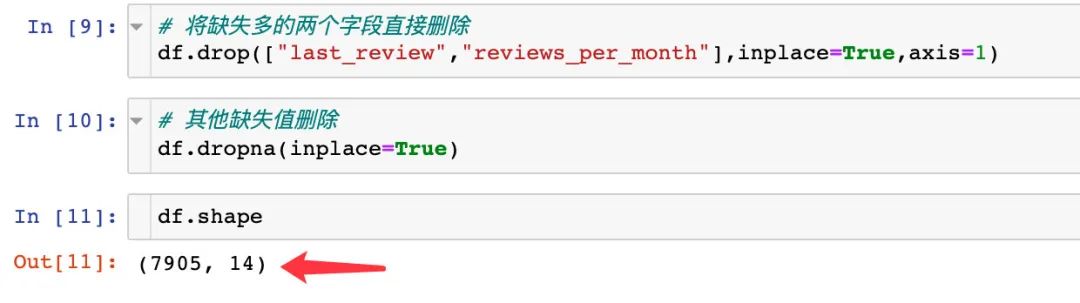
最终的数据变成了7905行和14个字段。原始数据是7907行,16个字段属性 数据EDAEDA全称是:Exploratory Data Analysis,主要是为了探索数据的分布情况 价格price整体的话,价格还是在1000以下 sns.distplot(df["price"]) # 直方图 plt.show()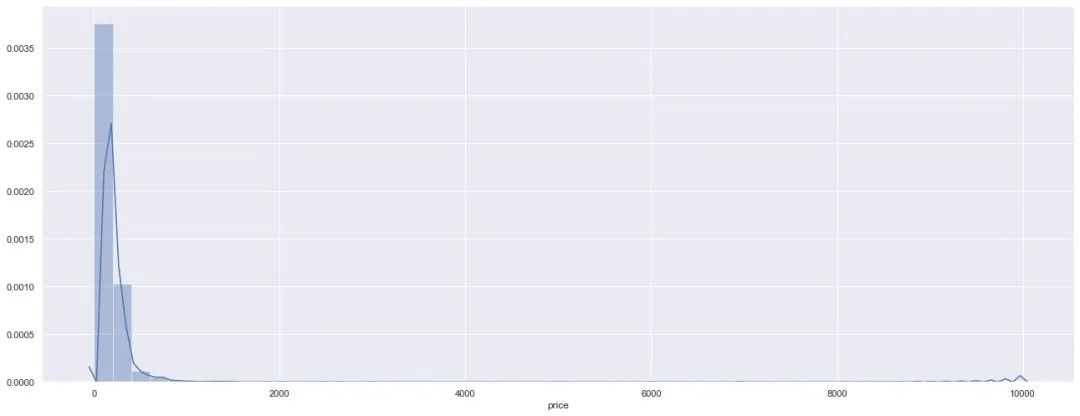
下面我们看看价格和最低预订天数的关系: sns.scatterplot(x="price",y="minimum_nights", # 每夜最少data=df)plt.show()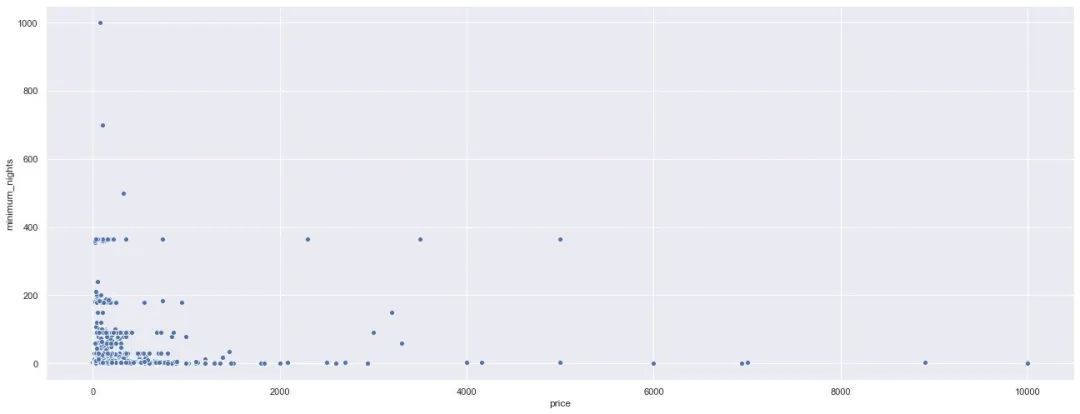
通过价格的散点图,也能够观察到主要的价格还是分布在最低预订天数在200以下的房源中 区域查看房屋的区域(地理为)分布:更多的房子位于Central Region位置。 sns.countplot(df["neighbourhood_group"]) plt.show()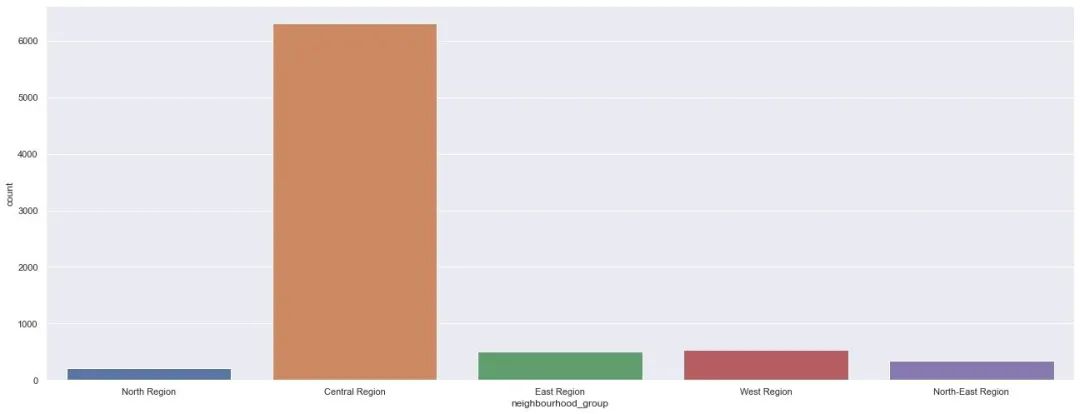
上面是从房源的数量上对比每个区域,下面是对比不同 df1 = df[df.price |
【本文地址】