Python基于jieba+wordcloud实现文本分词、词频统计、条形图绘制及不同主题的词云图绘制 |
您所在的位置:网站首页 › 热词统计图 › Python基于jieba+wordcloud实现文本分词、词频统计、条形图绘制及不同主题的词云图绘制 |
Python基于jieba+wordcloud实现文本分词、词频统计、条形图绘制及不同主题的词云图绘制
|
目录
序言:第三方库及所需材料函数模块介绍分词词频统计条形图绘制词云绘制主函数
效果预览全部代码
序言:第三方库及所需材料
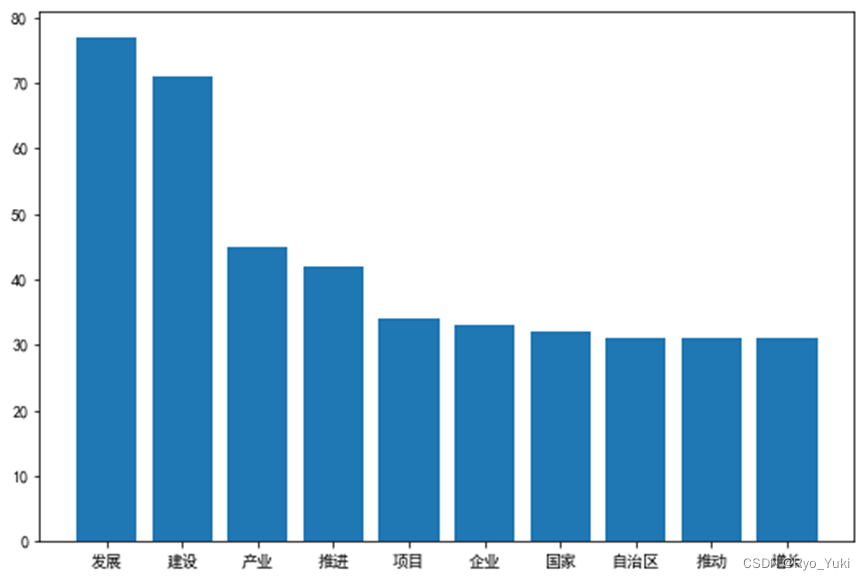
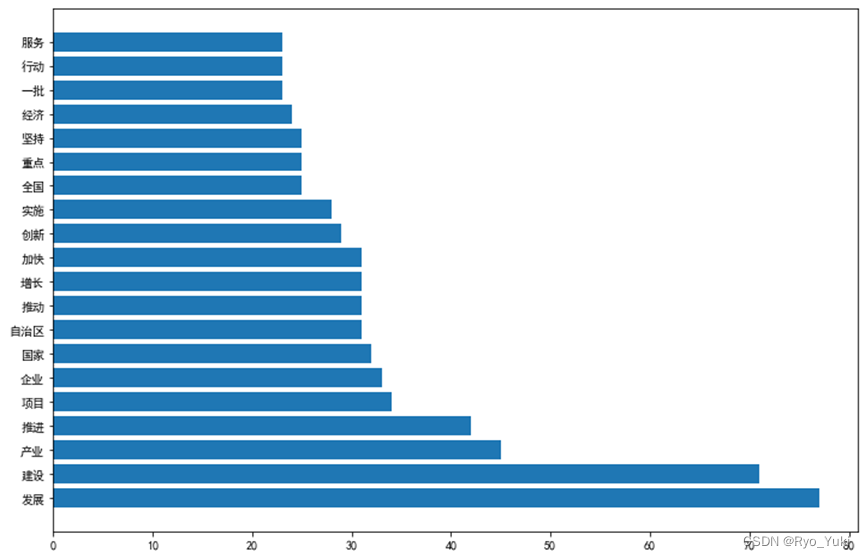
编程语言:Python3.9。 编程环境:Anaconda3,Spyder5。 使用到的主要第三方库:jieba-0.42.1,wordcloud-1.8.2.2,matplotlib-3.5.1。 文本数据:txt格式,本文以2023年内蒙古自治区政府工作报告为例,命名为“2023.txt”。停用词:“cn_stopwords.txt”,网络下载字体文件:tff格式,本文使用方正粗黑宋简体,命名为“fzch.tff”主题背景图片:本文使用白底内蒙古自治区地图,命名为“R-C.png”以上文件置于py文件的同级目录下,使用相对路径读取。 函数模块介绍具体的代码可见全部代码部分,这部分只介绍思路和相应的函数模块 分词在主函数中读取文本数据,调用分词函数cutWord,使用jieba分词库和停用词表对文本进行分词操作,并返回词语组成的列表。 def cutWord(text): words=jieba.cut(text) stopwords = {}.fromkeys([ line.rstrip() for line in open('cn_stopwords.txt',encoding='utf-8') ]) finalwords = [] for word in words: if word not in stopwords: if (word != "。" and word != ",") : finalwords.append(word) return finalwords 词频统计将词语列表传入词频统计函数countWord,去除单字词和换行符后,统计各词语出现的频率,并返回各词语的频数列表。 def countWord(text): counts={} for word in text: if len(word) == 1 or word=='\n':#单个词和换行符不计算在内 continue else: if word not in counts.keys(): counts[word]=1 else: counts[word]+=1 return counts 条形图绘制将词频字典传入高频词条形图绘制函数drawBar,根据注释传入参数,选择前RANGE项词语和图像横竖 def drawBar(countdict,RANGE, heng): #函数来源于:https://blog.csdn.net/leokingszx/article/details/101456624,有改动 #dicdata:字典的数据。 #RANGE:截取显示的字典的长度。 #heng=0,代表条状图的柱子是竖直向上的。heng=1,代表柱子是横向的。考虑到文字是从左到右的,让柱子横向排列更容易观察坐标轴。 by_value = sorted(countdict.items(),key = lambda item:item[1],reverse=True) print(by_value[:20]) x = [] y = [] plt.figure(figsize=(9, 6)) for d in by_value: x.append(d[0]) y.append(d[1]) if heng == 0: plt.bar(x[0:RANGE], y[0:RANGE]) plt.show() return elif heng == 1: plt.barh(x[0:RANGE], y[0:RANGE]) plt.show() return else: return "heng的值仅为0或1!" 词云绘制将词语列表传入词云绘制函数drawWordCloud,绘制词云图。进一步地,将词语列表传入词云绘制函数drawWordCloudwithMap,以内蒙古自治区地图为背景绘制词云图。 def drawWordCloud(textList): wc = WordCloud(font_path ="fzch.ttf",background_color="white",width=1800,height=1200).fit_words(countdict) plt.figure(figsize=(18, 12)) plt.imshow(wc) plt.axis("off") plt.show() def drawWordCloudwithMap(textList): d = path.dirname(__file__) map_coloring = np.array(Image.open(path.join(d, "R-C.png"))) wc = WordCloud(font_path ="fzch.ttf",mask=map_coloring,background_color="white",width=1800,height=1200).fit_words(countdict) plt.figure(figsize=(18, 12)) plt.imshow(wc) plt.axis("off") plt.show() 主函数 if __name__ == "__main__": with open('2023.txt','r',encoding='utf-8') as f: text=f.read()#读取文本 cutText=cutWord(text)#jieba分词 countdict=countWord(cutText)#生成词频字典 drawBar(countdict,10,0)#绘制词语出现次数前10的竖向条形图 drawBar(countdict,20,1)#绘制词语出现次数前20的横向条形图 drawWordCloud(cutText)#绘制词云图 drawWordCloudwithMap(cutText)#以地图为背景绘制词云图 效果预览
|


【本文地址】