|
Echarts--Js可视化实现[视觉盛宴]--动态三维条形图、柱状图、饼图、比例图、折线图
1、前言2、案列(基于电影推荐系统)2.1 观众年龄分配占比`在这里插入代码片`2.2 不同职位观影情况2.3 电影类型分配占比2.4 观影性别占比
3、文末彩蛋
1、前言
ECharts 提供了常规的折线图、柱状图、散点图、饼图、K线图,用于统计的盒形图,用于地理数据可视化的地图、热力图、线图,用于关系数据可视化的关系图、treemap、旭日图,多维数据可视化的平行坐标,还有用于 BI 的漏斗图,仪表盘,并且支持图与图之间的混搭。除了已经内置的包含了丰富功能的图表,ECharts 还提供了自定义系列,只需要传入一个renderItem函数,就可以从数据映射到任何你想要的图形,更棒的是这些都还能和已有的交互组件结合使用而不需要操心其它事情。你可以在下载界面下载包含所有图表的构建文件,如果只是需要其中一两个图表,又嫌包含所有图表的构建文件太大,也可以在在线构建中选择需要的图表类型后自定义构建。运用灵活。作图高端大气。今天来说一说如何用echarts作图。 若要运行或者自创代码请打开此链接,并且在下面图示中输入代码 
2、案列(基于电影推荐系统)
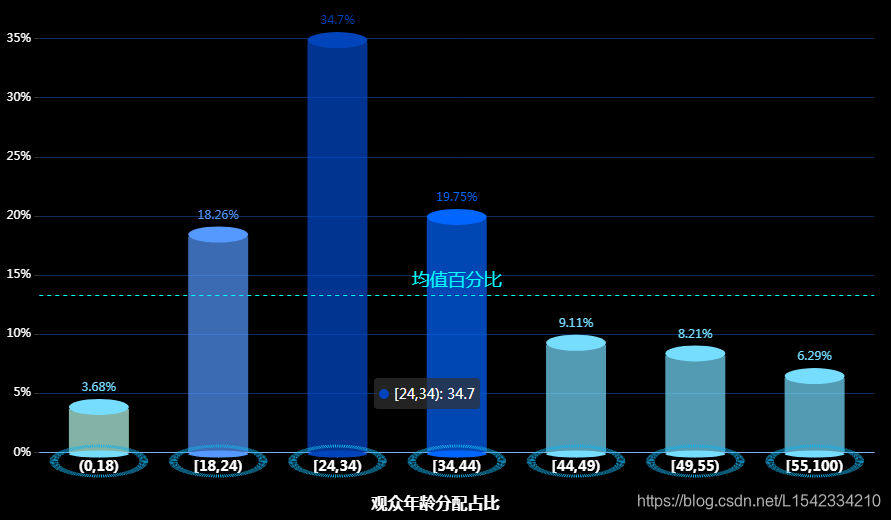
2.1 观众年龄分配占比在这里插入代码片
option = {
tooltip: {},// 加上该行,使得鼠标静止显示数据
backgroundColor: '#000000',
"grid": {
"top": "10%",
"left": "6%",
"bottom": "10%",
"right": "5%",
"containLabel": true
},
title: { //图表标题
text: "观众年龄分配占比",
left: "center",
bottom: "2%",
textStyle: {
color: "#fff",
fontSize: 16
}
},
xAxis: [{
"type": "category",
"data": ['(0,18)','[18,24)','[24,34)','[34,44)','[44,49)','[49,55)','[55,100)'], //这里需要加
"axisTick": {
"alignWithLabel": true
},
"nameTextStyle": {
"color": "#82b0ec" //眼色属性
},
"axisLine": {
"lineStyle": {
"color": "#82b0ec"
}
},
"axisLabel": {
"textStyle": {
"color": "#ffffff",
fontSize: 14, //字体大小
fontWeight:'bolder',//字体加粗
}
}
}],
"yAxis": [{
"type": "value",
"axisLabel": {
"textStyle": {
"color": "#ffffff"
},
"formatter": "{value}%"
},
"splitLine": {
"lineStyle": {
"color": "#0c2c5a",
fontWeight:'bolder',//字体加粗
}
},
"axisLine": {
"show": false
}
}],
"series": [{
"name": "",
type: 'pictorialBar',
symbolSize: [60, 16], //柱子上圈大小
symbolOffset: [0, -10], //上圈高度
symbolPosition: 'end',
z: 12,
//"barWidth": "20",
"label": {
"normal": {
"show": true,
"position": "top",
"formatter": "{c}%"
}
},
"data": [{ //第一个柱上的圆
"value": 3.68,
"itemStyle": {
"color": "#77ddff"
}
}, { //第二个柱上的圆
"value": 18.26,
"itemStyle": {
"color": "#5599ff"
}
},{
"value": 34.7,
"itemStyle": {
"color": "#0044bb"
}
},{
"value": 19.75,
"itemStyle": {
"color": "#0066ff"
}
},{
"value": 9.11,
"itemStyle": {
"color": "#77ddff"
}
},{
"value": 8.21,
"itemStyle": {
"color": "#77ddff"
}
},{
"value": 6.29,
"itemStyle": {
"color": "#77ddff"
}
}]
},
{
name: '',
type: 'pictorialBar',
symbolSize: [60, 7], //柱子下圈大小
symbolOffset: [0, 5], //柱子下圈高度
// "barWidth": "20",
z: 12,
"data": [{ //第一个柱下的圆
"value": 3.68,
"itemStyle": {
"color": "#77ddff"
}
}, {
"value": 18.26,
"itemStyle": {
"color": "#5599ff"
}
},{
"value": 34.7,
"itemStyle": {
"color": "#0044bb"
}
}, {
"value": 19.75,
"itemStyle": {
"color": "#0066ff"
}
},{
"value": 9.11,
"itemStyle": {
"color": "#77ddff"
}
}, {
"value": 8.21,
"itemStyle": {
"color": "#77ddff"
}
},{
"value": 6.29,
"itemStyle": {
"color": "#77ddff"
}
},]
},
{
name: '',
type: 'pictorialBar',
symbolSize: [90, 30],//柱子下圈外大小
symbolOffset: [0, 25],//柱子下圈外高度
z: 10,
itemStyle: {
normal: {
color: 'transparent',
borderColor: '#14b1eb',
borderType: 'dashed',
borderWidth: 5
}
},
data: [3.68,18.26,34.70,19.75,9.11,8.21,6.29]
},
{
type: 'bar',//柱子的类型
itemStyle: {
normal: {
//color: '#14b1eb',
opacity: .7
}
},
//silent: true,
"barWidth": "60",
//barGap: '-100%', // Make series be overlap
"data": [{
"value": 3.68, //第一个柱状图
"itemStyle": {
"color": "#bbffee"
}
}, {
"value": 18.26,//第二个柱状图
"itemStyle": {
"color": "#5599ff"
}
},{
"value": 34.70,//第四个柱状图
"itemStyle": {
"color": "#0044bb"
}
},{
"value": 19.75,//第五个柱状图
"itemStyle": {
"color": "#0066ff"
}
},{
"value": 9.11,//第三个柱状图
"itemStyle": {
"color": "#77ddff"
}
},{
"value": 8.21,//第六个柱状图
"itemStyle": {
"color": "#77ddff"
}
},{
"value": 6.29,//第七个柱状图
"itemStyle": {
"color": "#77ddff"
}
}],
markLine:{
symbol:'none',
label:{
position:"middle",
formatter:'{b}',
fontSize:18
},
data:[{
name:"均值百分比",
yAxis: 13.29,//res.targetTwo,
lineStyle:{
color:"#00ffff"
},
}]
}
}]
}
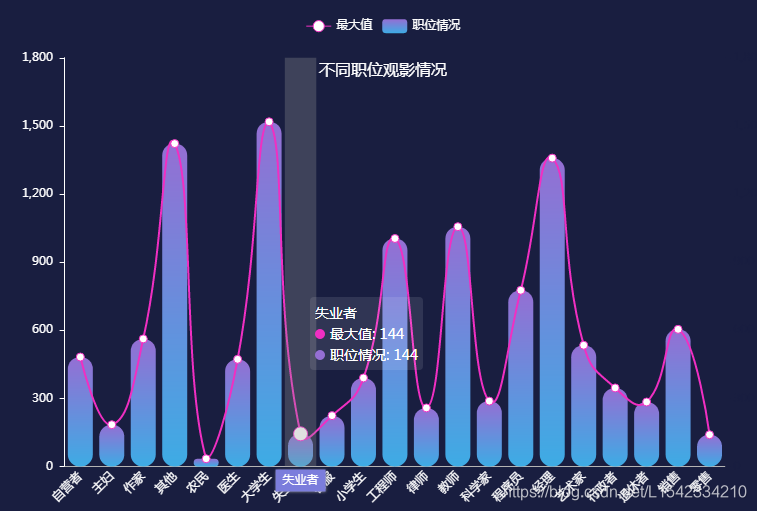
2.2 不同职位观影情况
// Generate data
var category = ['自营者','主妇','作家','其他','农民','医生','大学生',
'失业者','客服','小学生','工程师','律师','教师','科学家','程序员',
'经理','艺术家','行政者','退休者','销售','零售'];
var dottedBase = [];
var barData = [482,184,562,1422,34,472,1518,144,224,390,1004,258,
1056,288,776,1358,534,346,284,604,140];
var rateData = [];
for (var i = 0; i
grid: {
top: '15%', //顶端距离
right: '7%', //左距离
left: '10%',
bottom: '10%'
},
title: {
top: '15%',
text: '不同职位观影情况',
x: 'center',
y: 0,
textStyle:{
color:'#ffffff',
fontSize:16,
fontWeight:'normal',
},
},
backgroundColor: '#191E40',
tooltip: {
trigger: 'axis',
backgroundColor:'rgba(255,255,255,0.1)',
axisPointer: {
type: 'shadow',
label: {
show: true,
backgroundColor: '#7B7DDC'
}
}
},
legend: {
data: ['最大值', '职位情况'],
textStyle: {
color: '#ffffff' //标签颜色
},
top:'7%',
},
xAxis: {
data: category,
axisLine: {
lineStyle: {
color: '#B4B4B4'
}
},
axisLabel:{
rotate:45,
interval: 0, //显示所有横坐标标签
color: '#ffffff'
},
axisTick:{
show:false,
},
},
yAxis: [{
splitLine: {show: false},
axisLine: {
lineStyle: {
color: '#ffffff',//左边纵坐标
}
},
axisLabel:{
formatter:'{value} ',
interval: 0,
}
},
{
splitLine: {show: false},
axisLine: {
lineStyle: {
color: '#191E40',//右边纵坐标
}
},
axisLabel:{
formatter:'{value} ',
interval: 0,
}
}],
series: [{
name: '最大值',
type: 'line',
smooth: true,
showAllSymbol: true,
symbol: 'emptyCircle',
symbolSize: 8,
yAxisIndex: 1,
itemStyle: {
normal: {
color:'#F02FC2'},
},
data: rateData
},
{
name: '职位情况',
type: 'bar',
barWidth: 25,
itemStyle: {
normal: {
barBorderRadius: 12,//柱头的锋利度
color: new echarts.graphic.LinearGradient(
0, 0, 0, 1,
[
{offset: 0, color: '#956FD4'},
{offset: 1, color: '#3EACE5'}
]
)
}
},
data: barData
}]
};
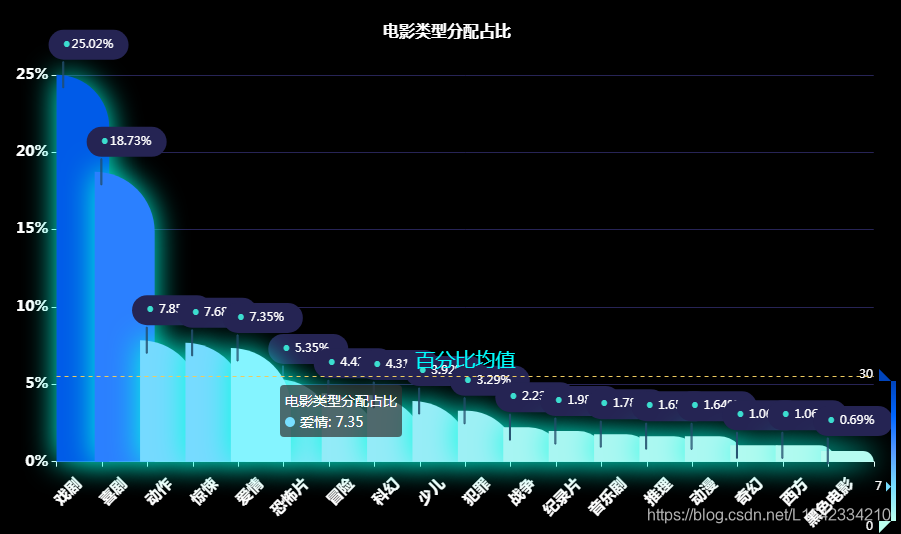
2.3 电影类型分配占比
option = {
tooltip: {},// 加上该行,使得鼠标静止显示数据
backgroundColor: '#000000',
grid: {
top: '15%', //顶端距离
right: '3%', //左距离
left: '7%',
bottom: '14%'
},
title:{
top: '5%',
text:'电影类型分配占比',
left: "center",
textStyle: {
color: "#fff",
fontSize: 16
}
},
xAxis: [{
type: 'category',
color: '#ffffff',
data: ['戏剧','喜剧','动作','惊悚','爱情','恐怖片','冒险','科幻','少儿','犯罪',
'战争','纪录片','音乐剧','推理','动漫','奇幻','西方','黑色电影'],
axisPointer: {
type: 'line'
},
axisLine: {
lineStyle: {
color: '#ffffff'
}
},
axisLabel: {
rotate:45,//字体倾斜
interval: 0,//interval: 0 将横轴字体全部显示
margin: 20,
color: '#ffffff',// 横轴字体颜色
textStyle: {
fontSize: 15, //字体大小
fontWeight:'bolder',//字体加粗
}
}}],
yAxis: [{ //设置y轴字体属性
min: 0,
max: 25, // 设置最大百分比
axisLabel: {
formatter: '{value}%',
color: '#ffffff', // 横轴字体颜色
textStyle: {
fontSize: 15, //字体大小
fontWeight:'bolder',//字体加粗
}
},
axisLine: {
lineStyle: {
color: '#ffffff'
},
show: false
},
splitLine: {
lineStyle: {
color: '#272456'
}
}
}],
series: [{
name:'电影类型分配占比',
type: 'bar',
data: [25.02,18.73,7.85,7.68,7.35,5.35,4.42,4.31,
3.92,3.29,2.23,1.98,1.78,1.65,1.64,1.06,1.06,0.69],
barWidth: '60px',//条形的宽度
itemStyle: {
normal: {
color: new echarts.graphic.LinearGradient(100, 0, 0, 1, [{
offset: 0,
color: '#41E1D4' // 0% 处的颜色
}, {
offset: 1,
color: '#10A7DB' // 100% 处的颜色
}], false),
barBorderRadius: [0, 90, 0, 0], //柱头样式
shadowColor: 'rgba(0,255,225,1)',
shadowBlur: 30, //条形发光度
}
},
label: {
normal: {
show: true,
lineHeight: 30,
width: 80,
height: 30,
backgroundColor: '#252453',
borderRadius: 200,
position: ['-8', '-45'], //标签的位置
distance: 1,
formatter: [
' {d|●}',
' {a|{c}%} \n',
' {b|}'
].join(''),
rich: {
d: {
color: '#3CDDCF',
},
a: {
color: '#fff',
align: 'center',
},
b: {
width: 1,
height: 26,//线杆的长度
borderWidth: 1,
borderColor: '#234e6c',
align: 'left'
},
}
}
},
markLine:{ //添加指引线
timeline:60,
symbol:'none',
label:{
position:"middle",
formatter:'{b}',
fontSize:20, //平均值字体大小
color:'#00ffff'//平均值字体颜色
},
data:[{
yAxis:5.5,//res.targetTwo,
lineStyle:{
color:"#eecb5f"
},
name:"百分比均值"
}]
}
}],
visualMap: { //图例值控制 在opption下
left:"right",//位置在右端
itemWidth:5,//图列宽度
realtime:true, //拖拽时,是否实时更新
min: 0,
max: 30,
calculable: true, //是否显示拖拽用的手柄
show: true,
color: ['#0044bb','#0066ff','#5599ff','#77ddff','#bbffee'],
textStyle: {
color: '#fff'
}
}
};
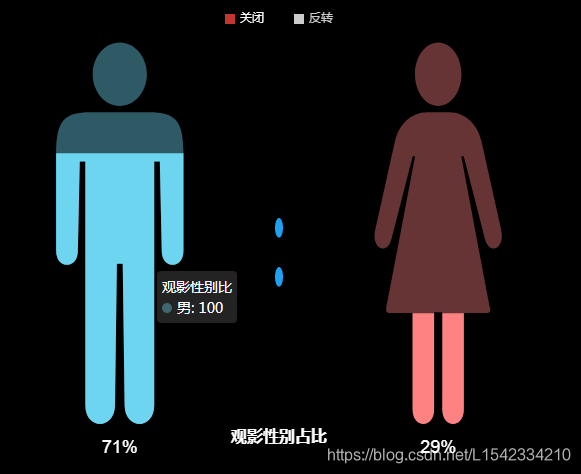
2.4 观影性别占比
var bodyMax = 100; //指定图形界限的值
var labelSetting = {
normal: {
show: true,
position: 'bottom',
offset: [0, 10],
formatter: function(param) {
return (param.value / bodyMax * 100).toFixed(0) + '%';
},
textStyle: {
fontSize: 18,
fontFamily: 'Arial',
color: '#ffffff' // 设置百分比的颜色
}
}
};
var markLineSetting = { //设置标线
symbol: 'none',
lineStyle: {
normal: {
opacity: 0.3
}
},
data: [{
type: 'max',
label: {
normal: {
formatter: 'max: {c}'
}
}
}, {
type: 'min',
label: {
normal: {
formatter: 'min: {c}'
}
}
}]
};
option = {
backgroundColor: '#000000',
tooltip: {
show: true, //鼠标放上去显示悬浮数据
},
title: { //图表标题
text: "观影性别占比",
left: "center",
bottom: "15%",
textStyle: {
color: "#fff",
fontSize: 16
}
},
legend: {
data: ['关闭', '反转'],
selectedMode: 'single',
itemWidth: 10, //图例的宽度
itemHeight: 10, //图例的高度
itemGap: 30,
orient: 'horizontal',
left: 'center',
top: '20px',
icon: 'rect',
// selectedMode: false, //取消图例上的点击事件
textStyle: {
color: '#ffffff'
},
},
grid: {
left: '20%',
right: '20%',
top: '10%',
bottom: '20%',
containLabel: true
},
xAxis: {
data: ['男', 'x', '女'],
axisTick: {
show: false
},
axisLine: {
show: false
},
axisLabel: {
show: false
}
},
yAxis: {
max: bodyMax,
splitLine: {
show: false
},
axisTick: {
// 刻度线
show: false
},
axisLine: {
// 轴线
show: false
},
axisLabel: {
// 轴坐标文字
show: false
}
},
series: [{
name: '关闭',
type: 'pictorialBar',
symbolClip: true,
symbolBoundingData: bodyMax,
label: labelSetting,
data: [{
value: 71,
symbol: symbols[0],
itemStyle: {
normal: {
color: 'rgba(105,204,230)' //单独控制颜色
}
},
},
{
},
{
value: 29,
symbol: symbols[1],
itemStyle: {
normal: {
color: 'rgba(255,130,130)' //单独控制颜色
}
},
}
],
// markLine: markLineSetting,
z: 10
},
{
name: '反转',
type: 'pictorialBar',
symbolClip: true,
symbolBoundingData: bodyMax,
label: labelSetting,
data: [{
value: 29, //反转后显示的值
symbol: symbols[0]
},
{},
{
value: 71,
symbol: symbols[1]
}
],
// markLine: markLineSetting,
z: 10
},
{
// 设置背景底色,不同的情况用这个
name: '观影性别比',
type: 'pictorialBar', //异型柱状图 图片、SVG PathData
symbolBoundingData: bodyMax,
animationDuration: 0,
itemStyle: {
normal: {
color: '#ccc' //设置全部颜色,统一设置
}
},
z: 10,
data: [{
itemStyle: {
normal: {
color: 'rgba(105,204,230,0.40)' //单独控制颜色
}
},
value: 100,
symbol: symbols[0]
},
{
// 设置中间冒号
itemStyle: {
normal: {
color: '#1DA1F2' //中间冒号颜色
}
},
value: 100,
symbol: symbols[2],
symbolSize: [8, '18%'],
symbolOffset: [0, '-200%']
},
{
itemStyle: {
normal: {
color: 'rgba(255,130,130,0.40)' //单独控制颜色
}
},
value: 100,
symbol: symbols[1]
}
]
}
]
}
3、文末彩蛋
虽然说代码较多复杂,但是图形真的是非常帅气。重点!重点!下一篇是R语言调用echart接口作地图与地图可视化迁移。请不要走开!继续喊出我的可视化口号:要么有用!要么有趣!
今天到这里就结束啦~这里是Jeruser视觉盛宴栏目,让你体验不一样的数据分析,如何将工作变得有趣,请持续关注我。谢谢观看我是Jetuser–data
链接: [https://blog.csdn.net/L1542334210] CSND:L1542334210  祝大家工作顺利!阖家欢乐! 祝大家工作顺利!阖家欢乐!
|