|
柱状图之坐标轴截断

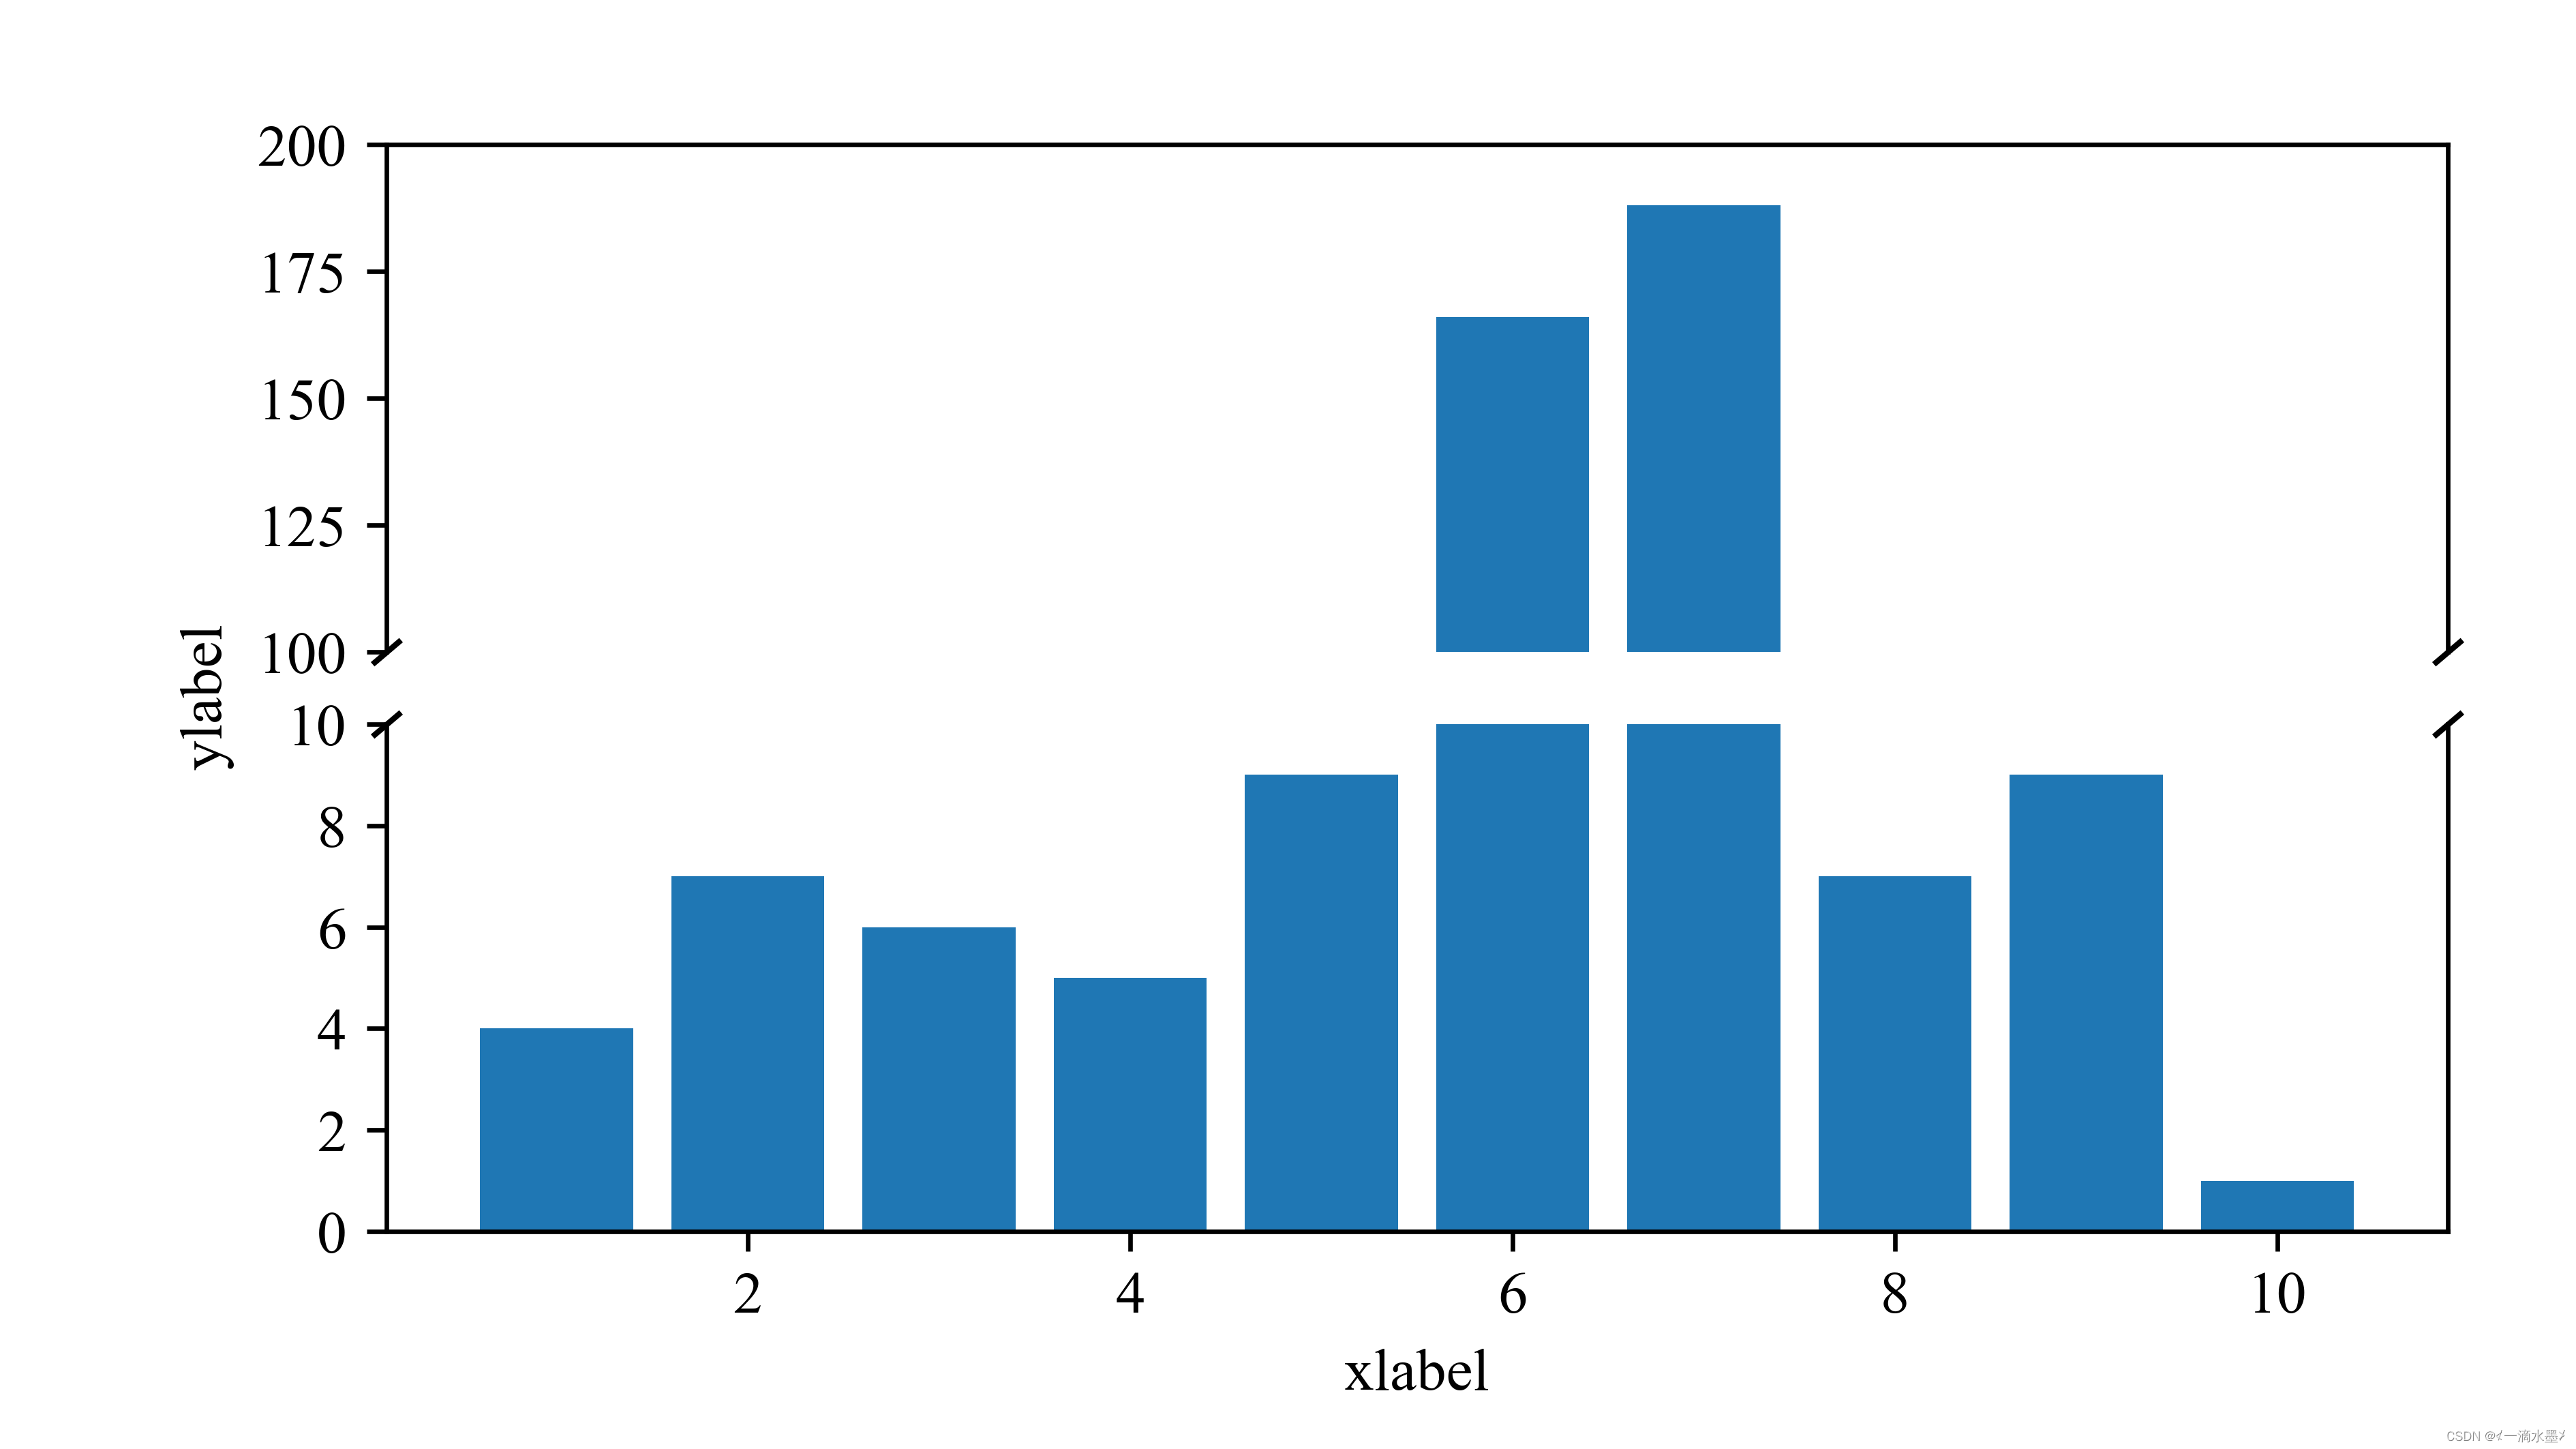
当一组数据差距过大时,单个y轴则不能很好的展现数据,如下图所示,可以设置双y轴或者截断y轴,从而使数据展示的更好。
原始效果:

最终效果:
代码如下:
# -*- encoding: utf-8 -*-
'''
@File : broken_plot.py
@Time : 2022/06/07 21:59:01
@Author : HMX
@Version : 1.0
@Contact : [email protected]
'''
# here put the import lib
import matplotlib.pyplot as plt
import matplotlib as mpl
import numpy as np
def cm2inch(a,b):
return a/2.54,b/2.54
def plot_broken(ax1,ax2):
#绘制断裂处的标记
d = .85 #设置倾斜度
kwargs = dict(marker=[(-1, -d), (1, d)], markersize=5,
linestyle='none', color='k', mec='k', mew=1, clip_on=False)
ax2.plot([0, 1], [0, 0],transform=ax2.transAxes, **kwargs)
ax1.plot([0, 1], [1, 1], transform=ax1.transAxes, **kwargs)
ax2.spines['bottom'].set_visible(False)#关闭子图2中底部脊
ax1.spines['top'].set_visible(False)##关闭子图1中顶部脊
ax2.set_xticks([])
size1 = 10.5
mpl.rcParams.update(
{
'text.usetex': False,
'font.family': 'stixgeneral',
'mathtext.fontset': 'stix',
"font.family":'serif',
"font.size": size1,
"font.serif": ['Times New Roman'],
}
)
# 构造数据
np.random.seed(1234)
y = np.random.randint(1,10,10)
y[5] = 166
y[6] = 188
x = range(1,len(y)+1)
# 构造fig,ax
fig = plt.figure(figsize = (cm2inch(16,9)))
ax1 = fig.add_axes([0.15,0.15,0.8,0.35])
ax2 = fig.add_axes([0.15,0.55,0.8,0.35])
ax1.bar(x,y)
ax2.bar(x,y)
ax1.set_ylim(0,10)
ax2.set_ylim(100,200)
ax1.set_yticks(np.arange(0,11,2))
plot_broken(ax1,ax2)
ax1.set_xlabel('xlabel')
ax2.set_ylabel('ylabel ')#空格调节令ylabel居中
plt.savefig(r'out.png',dpi = 600)
plt.show()
如果对你有帮助的话,请‘点赞’、‘收藏’,‘关注’,你们的支持是我更新的动力。 欢迎关注公众号【森气笔记】。
|