SpringBoot + MySQL + Echarts数据可视化 |
您所在的位置:网站首页 › 数据统计报表系统怎么做 › SpringBoot + MySQL + Echarts数据可视化 |
SpringBoot + MySQL + Echarts数据可视化
|
本博文主要讲解如何从数据库里获取数据进行可视化。具体方式为:数据存在MySQL数据库里,通过SpringBoot和Mybatis-Plus搭建后台,提供接口给前端调用,前端用Echarts实现数据可视化。
环境准备
JDK1.8 Maven3.3.9 MySQL5.7 IDEA 建库建表新建名为test的数据库 CREATE DATABASE IF NOT EXISTS test DEFAULT CHARSET utf8 COLLATE utf8_general_ci;新建goods表及插入表数据 CREATE TABLE `goods` ( `id` int(11) NOT NULL, `name` varchar(50) NOT NULL, `num` int(11) NOT NULL ) ENGINE=InnoDB DEFAULT CHARSET=utf8; INSERT INTO `goods` (`id`, `name`, `num`) VALUES (1, '衬衫', 10), (2, '羊毛衫', 20), (3, '雪纺衫', 50), (4, '裤子', 30), (5, '高跟鞋', 23), (6, '袜子', 60); 新建SpringBoot工程进入如下网站 https://start.spring.io/
下载了zip文件,解压zip文件后,并用IDEA打开
修改pom.xml 添加mybatis-plus依赖 com.baomidou mybatis-plus-boot-starter 3.1.2去掉mysql-connector-java下面的runtime变为如下: mysql mysql-connector-java添加lombok依赖 org.projectlombok lombok 1.18.4
重命名application.properties为application.yml
application.yml内容如下: spring: datasource: driver-class-name: com.mysql.cj.jdbc.Driver url: jdbc:mysql://localhost:3306/test?useUnicode=true&characterEncoding=UTF-8&serverTimezone=Asia/Shanghai&zeroDateTimeBehavior=CONVERT_TO_NULL username: root password: 123提示:注意修改mysql数据库的用户名及密码 后台代码按如下目录结构新建出相应的类
service.impl实现类 package com.example.springbootmysqlecharts.service.impl; import com.baomidou.mybatisplus.extension.service.impl.ServiceImpl; import com.example.springbootmysqlecharts.dao.GoodsDao; import com.example.springbootmysqlecharts.entity.GoodsEntity; import com.example.springbootmysqlecharts.service.GoodsService; import org.springframework.stereotype.Service; @Service("goodsService") public class GoodsServiceImpl extends ServiceImpl implements GoodsService { } controller类 package com.example.springbootmysqlecharts.controller; import com.example.springbootmysqlecharts.entity.GoodsEntity; import com.example.springbootmysqlecharts.service.GoodsService; import org.springframework.beans.factory.annotation.Autowired; import org.springframework.web.bind.annotation.RequestMapping; import org.springframework.web.bind.annotation.RestController; import java.util.List; @RestController @RequestMapping("goods") public class GoodsController { @Autowired private GoodsService goodsService; @RequestMapping("/list") public List list(){ return goodsService.list(); } } 启动项目点击启动键
正常启动后如下图所示:
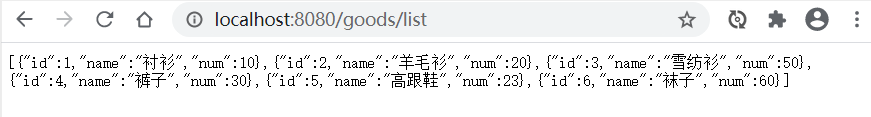
打开浏览器,地址栏输入: http://localhost:8080/goods/list看到如下输出为正常
进入echarts官网下载 https://echarts.apache.org/zh/download.html
下载得到zip文件,解压后,进入dist目录,找到echarts.min.js
在SpringBoot的static目录下新建js目录,并复制echarts.min.js到新建的js目录中
在templates目录下新建index.html文件 ECharts // 基于准备好的dom,初始化echarts实例 var myChart = echarts.init(document.getElementById('main')); // 指定图表的配置项和数据 var option = { title: { text: 'ECharts 入门示例' }, tooltip: {}, legend: { data:['销量'] }, xAxis: { data: ["衬衫","羊毛衫","雪纺衫","裤子","高跟鞋","袜子"] }, yAxis: {}, series: [{ name: '销量', type: 'bar', data: [5, 20, 36, 10, 10, 20] }] }; // 使用刚指定的配置项和数据显示图表。 myChart.setOption(option); 配置静态资源访问修改properties.yml, 添加 resources: static-locations: classpath:/templates/, classpath:/static/
提示:注意resources属于spring的下一级属性,要有两个空格 ,和datasource对齐。 测试启动项目,浏览器访问 http://localhost:8080/index.html
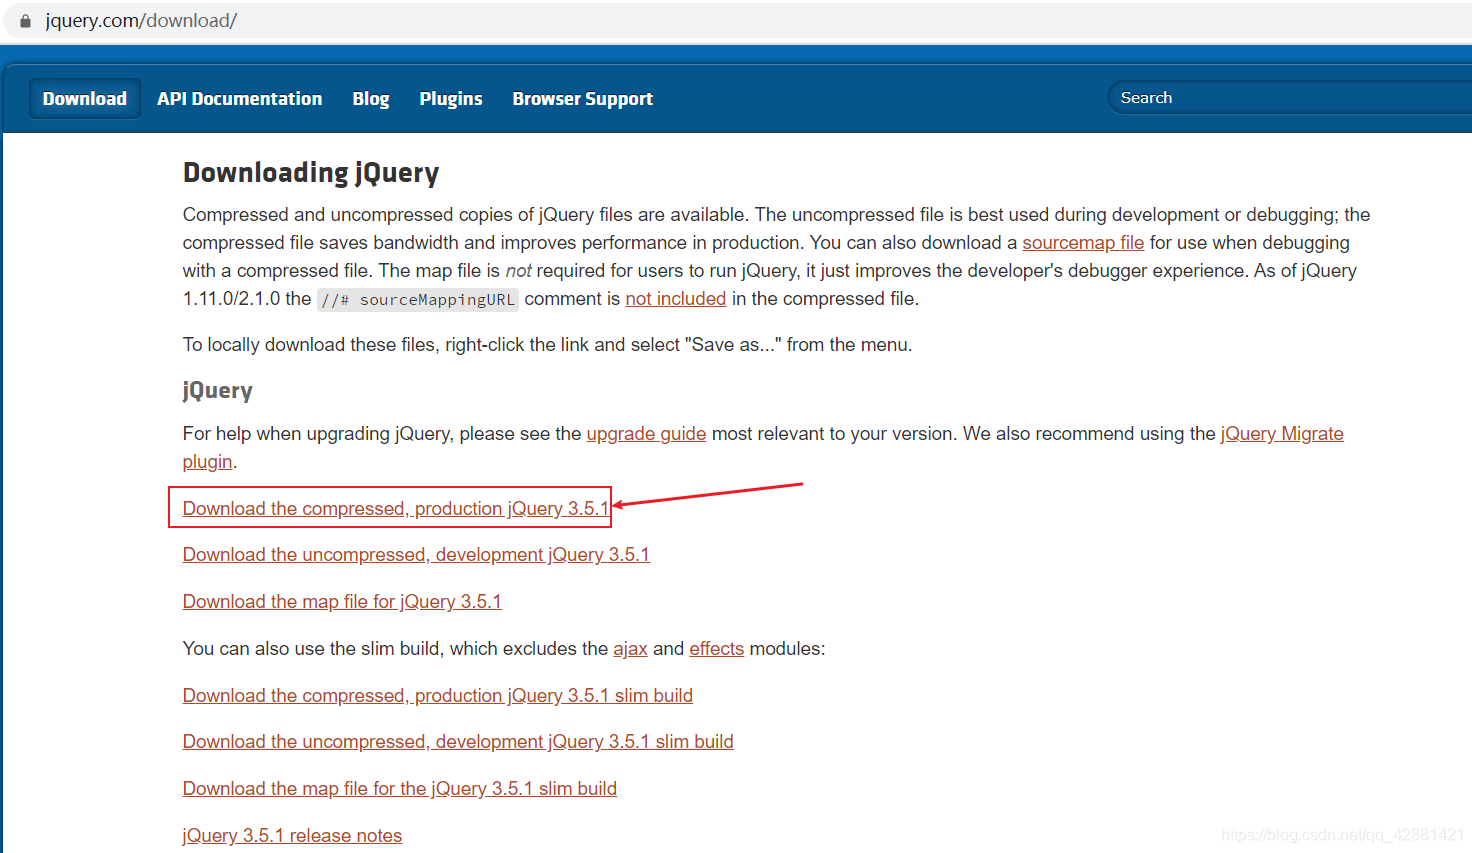
进入官网下载最近版本的jquery https://jquery.com/download/
如果官网下载慢,可以到如下地址下载最新版本 http://www.jq22.com/jquery-info122
解压下载文件后,复制jquery-3.5.1.min.js到Springboot的resources/static/js目录下
修改index.html文件 引入jquery
在myChart.setOption(option);语句前面添加请求后台数据,并用数据库的值赋值给x、y轴的数据。 // 定义x、y轴数据数组 var names=[]; var nums=[]; //请求后台数据 $.ajax({ type: "get", url: "/goods/list", contentType: "application/json", success: function(res){ console.log("=====res: =======") console.log(res); for (var i = 0; i < res.length ; i++) { names.push(res[i].name); nums.push(res[i].num); } myChart.setOption({ xAxis: { data: names }, series: [{ // 根据名字对应到相应的系列 name: '销量', data: nums }] }); } }); index.html完整代码 ECharts // 基于准备好的dom,初始化echarts实例 var myChart = echarts.init(document.getElementById('main')); // 指定图表的配置项和数据 var option = { title: { text: 'ECharts 入门示例' }, tooltip: {}, legend: { data:['销量'] }, xAxis: { data: ["衬衫","羊毛衫","雪纺衫","裤子","高跟鞋","袜子"] }, yAxis: {}, series: [{ name: '销量', type: 'bar', data: [5, 20, 36, 10, 10, 20] }] }; // 定义x、y轴数据数组 var names=[]; var nums=[]; //请求后台数据 $.ajax({ type: "get", url: "/goods/list", contentType: "application/json", success: function(res){ console.log("=====res: =======") console.log(res); for (var i = 0; i < res.length ; i++) { names.push(res[i].name); nums.push(res[i].num); } myChart.setOption({ xAxis: { data: names }, series: [{ // 根据名字对应到相应的系列 name: '销量', data: nums }] }); } }); // 使用刚指定的配置项和数据显示图表。 myChart.setOption(option); 测试启动项目,浏览器访问 http://localhost:8080/index.html
经对比数据,echarts确实显示了数据库中的数据。
完成! enjoy it!
|


【本文地址】
今日新闻 |
推荐新闻 |