基于easyX和vs使用c++绘制坐标系以及实时显示 |
您所在的位置:网站首页 › 怎样绘制坐标图 › 基于easyX和vs使用c++绘制坐标系以及实时显示 |
基于easyX和vs使用c++绘制坐标系以及实时显示
|
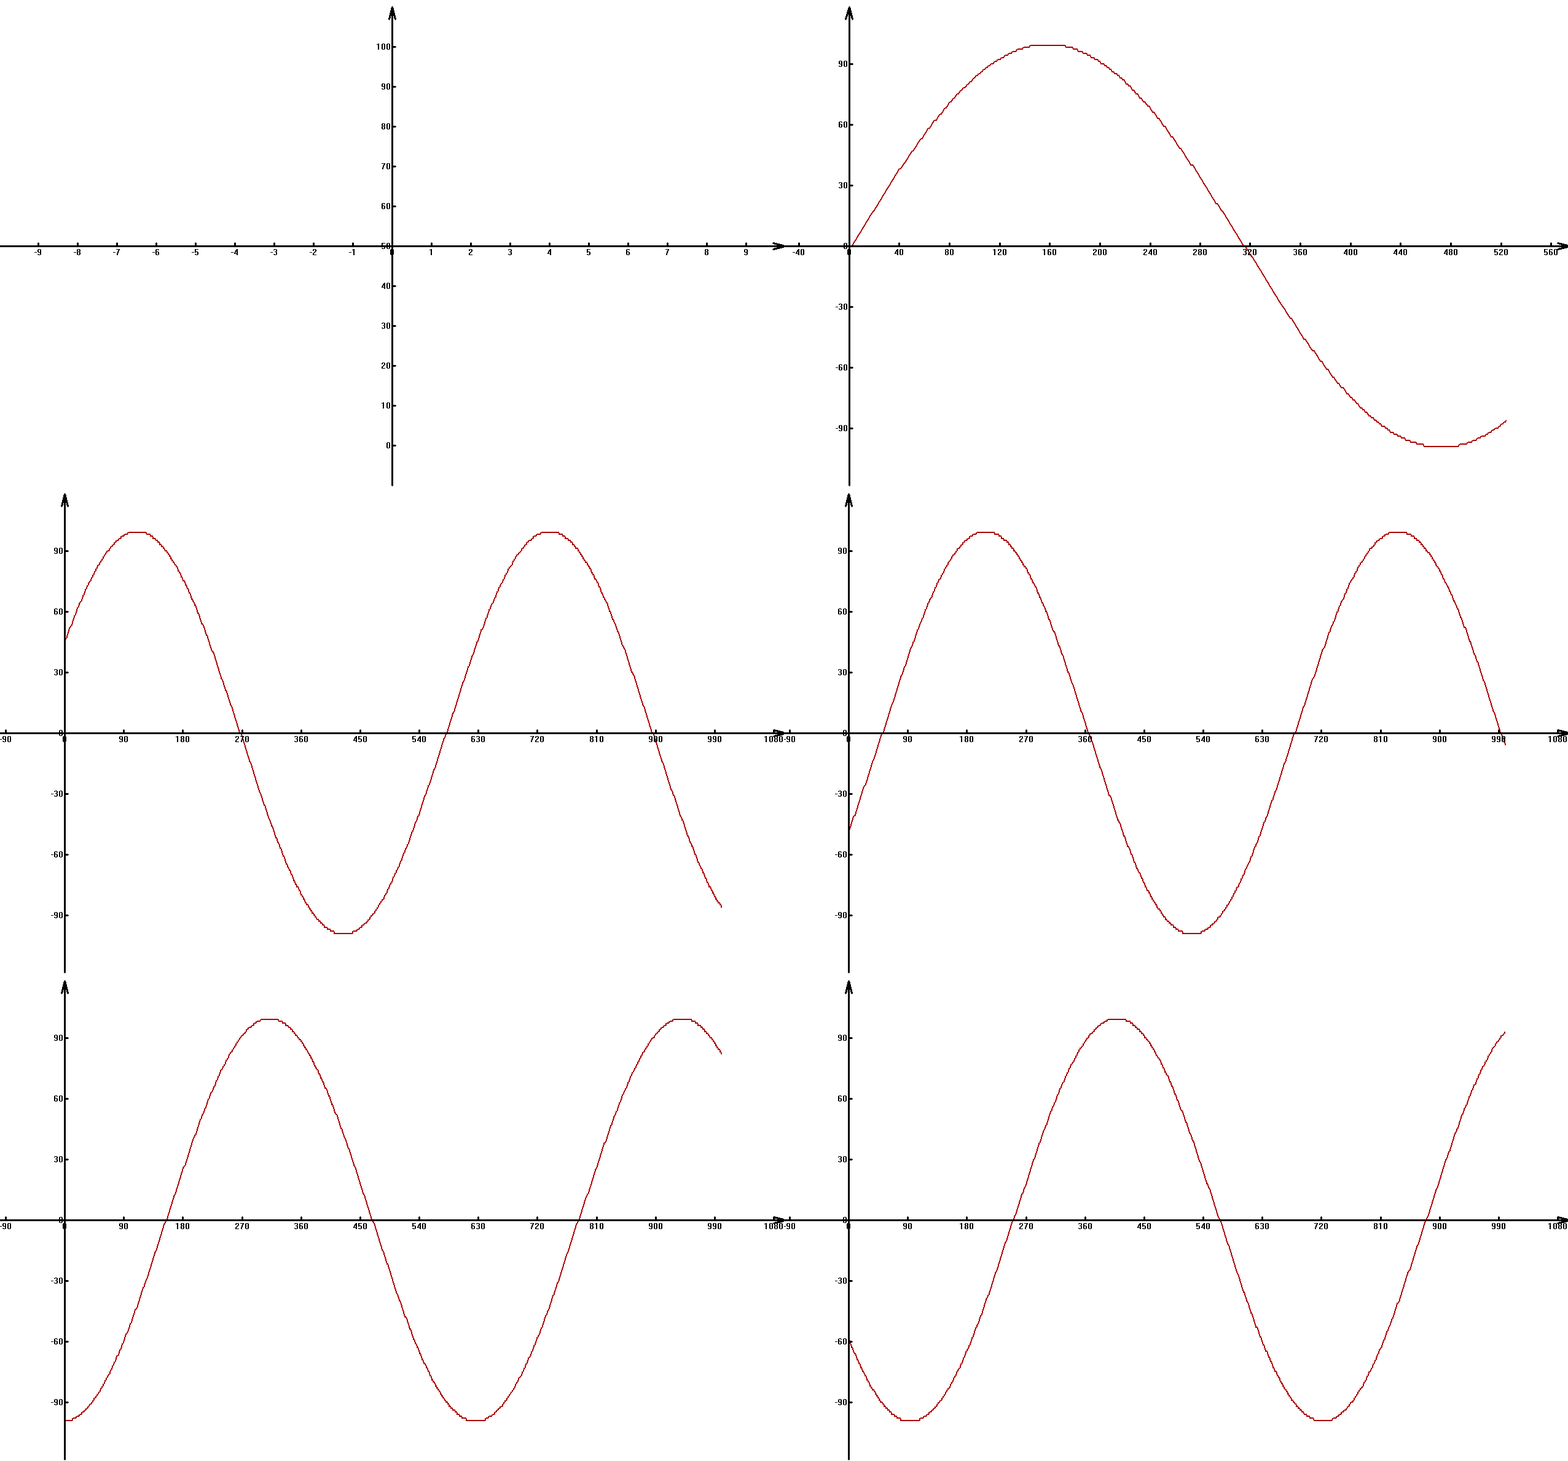
由于现在在windows下用c语言写一些算法,c语言并没有自己的图形界面库,所以在调试的时候很不方便。相信很多使用c语言开发的朋友都会为此而苦恼。所以最近我基于easyX写了一个实时绘制数据的程序,希望可以给大家一些帮助。 easyX是一个c++的图形库,只能在windows上使用,而且一般只能在vs或者vc上面使用(我用的vs),限制条件比较多,如果大家想用,还是老老实实安装软件吧,先装vs,然后安装easyX。easyX安装起来很简单。 先给大家看一下效果: 静态显示(不带网格):
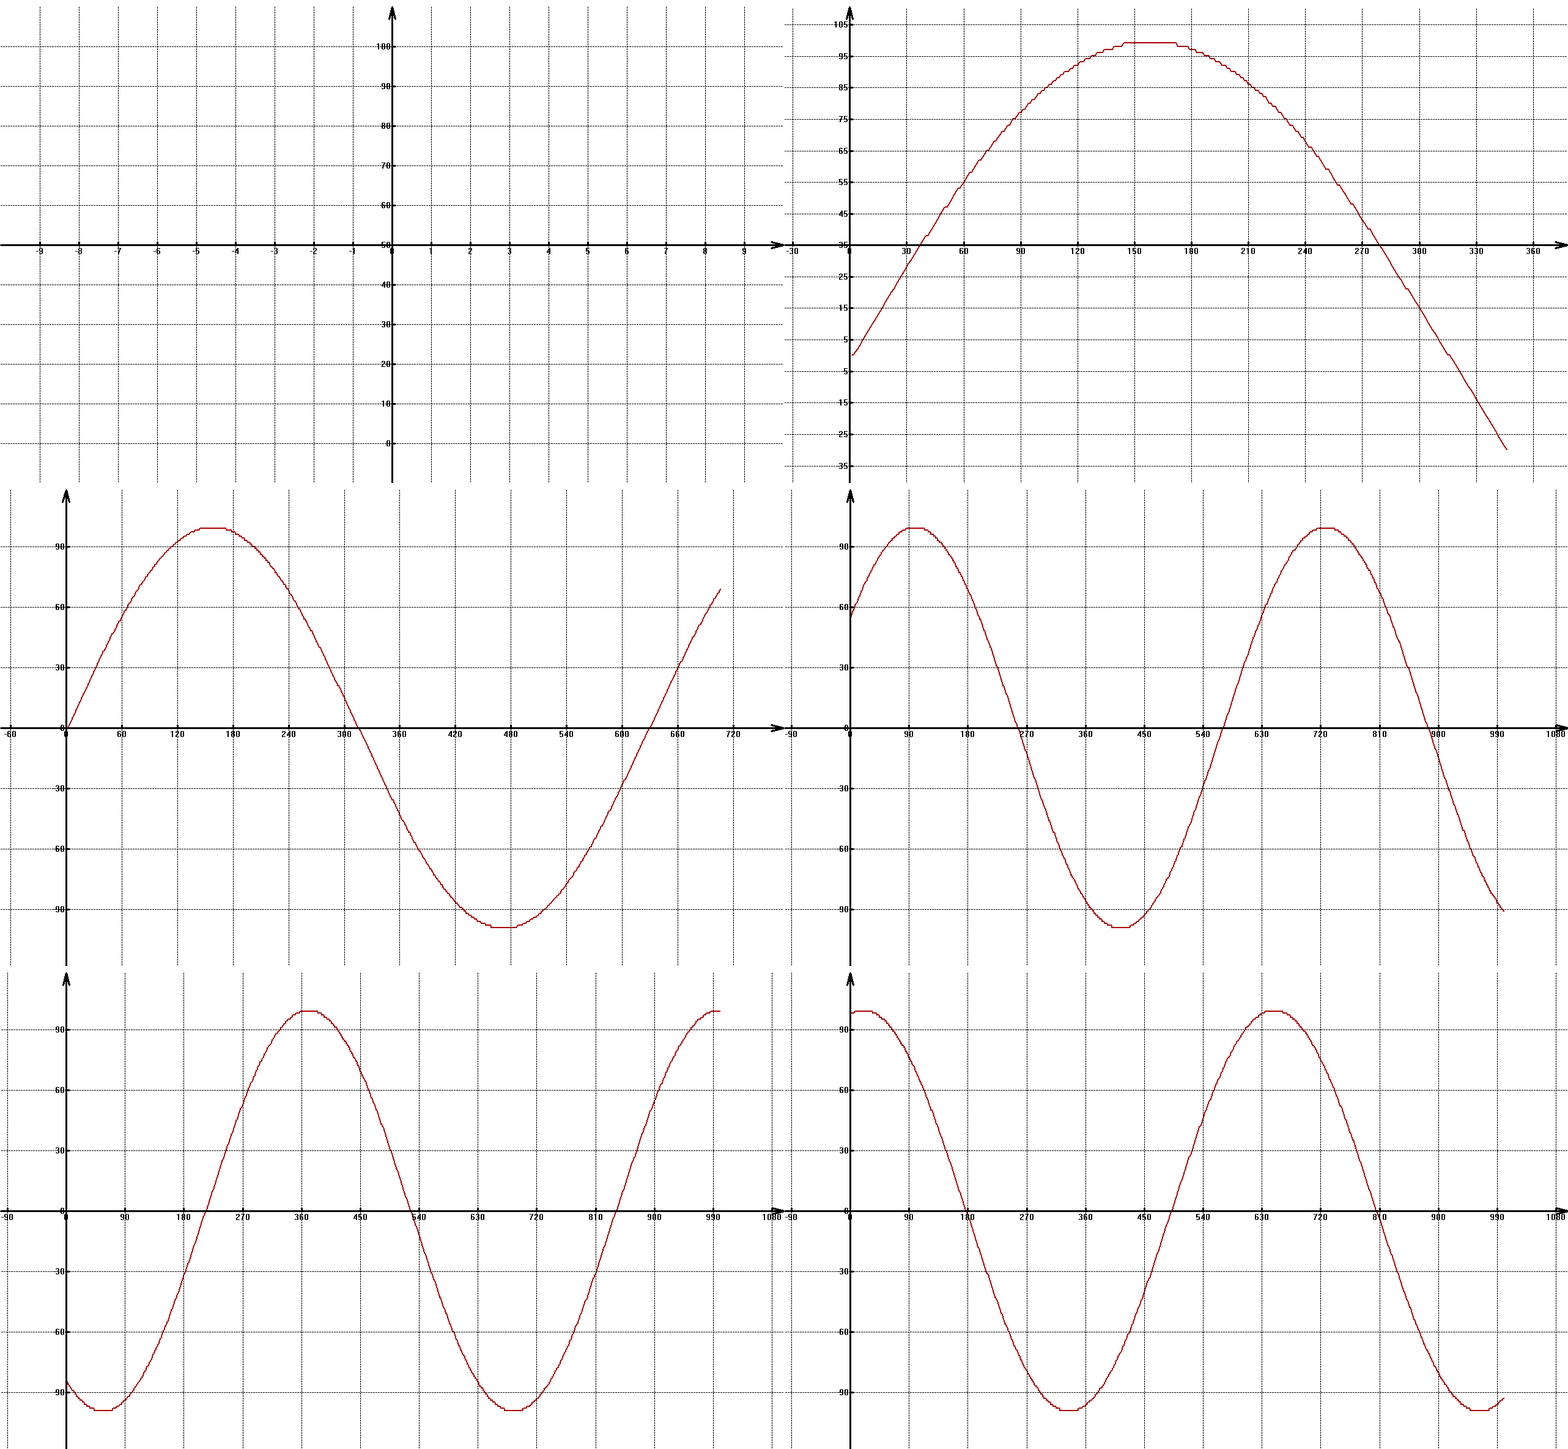
静态显示(带网格,这里网格线将刻度值的负号遮盖了,理解万岁):
动态绘制(无网格):
动态绘制(有网格):
动态绘制时,使用了一个循环队列,然后每一次重新绘制队列中的所有元素 接下来是代码: 先是循环队列的代码: queue.h #ifndef _QUEUE_H #define _QUEUE_H //循环队列的大小 #define MAXSIZE 1000 typedef struct queueint { int data[MAXSIZE]; int front, rear; }QueueInt; typedef struct queueintfloat { float data[MAXSIZE]; int front, rear; }QueueFloat; void queueInitFloat(QueueFloat* queue); int insertFloat(QueueFloat* queue,float a); int deleteFloat(QueueFloat* queue); int getSizeFloat(QueueFloat* queue); void queueInitInt(QueueInt* queue); int insertInt(QueueInt* queue, int a); int deleteInt(QueueInt* queue); int getSizeInt(QueueInt* queue); #endifqueue.cpp #include "queue.h" void queueInitFloat(QueueFloat* queue) { queue->front = 0; queue->rear = 0; for (int i = 0; i < MAXSIZE; i++) queue->data[i] = 0; } int insertFloat(QueueFloat* queue, float a) { if ((queue->rear + 1)%MAXSIZE==queue->front) { return 1; } queue->data[queue->rear++] = a; return 0; } int deleteFloat(QueueFloat* queue) { if (queue->front == queue->rear) { return 1; } queue->front++; return 0; } int getSizeFloat(QueueFloat* queue) { int res = queue->rear - queue->front; if (res < 0) { res += MAXSIZE; } return res; } void queueInitInt(QueueInt* queue) { queue->front = 0; queue->rear = 0; for (int i = 0; i < MAXSIZE; i++) queue->data[i] = 0; } int insertInt(QueueInt* queue, int a) { if ((queue->rear + 1) % MAXSIZE == queue->front) { return 1; } queue->data[queue->rear++] = a; queue->rear %= MAXSIZE; return 0; } int deleteInt(QueueInt* queue) { if (queue->front == queue->rear) { return 1; } queue->front++; queue->front %= MAXSIZE; return 0; } int getSizeInt(QueueInt* queue) { int res = queue->rear - queue->front; if (res < 0) { res += MAXSIZE; } return res; }然后是坐标系的绘制,以及绘图代码 drawCoordinateSystem.h #pragma once #ifndef DrawCoordinateSystem #define DrawCoordinateSystem #include "queue.h" /* 这是绘制坐标系的函数 1、轴 2、刻度 3、原点 4、网格 5、图幅 6、箭头 */ //轴结构体 struct Axis { int xlow, xhigh; int ylow, yhigh; int centerx,centery; float ax, ay; //压缩 int color; }; //刻度结构体 struct Scale { int openflag; //是否开启 int scalex; //刻度大小 int scaley; int color; }; struct Grid{ int openflag; int color; }; typedef struct coordinatesystem { struct Axis axis; struct Scale scale; int zerox, zeroy; //坐标系原点 struct Grid grid; int length, width; //图幅长宽 int color; //背景颜色 int borderx, brodery; //边界空出的范围 }CoordinateSystem; void coordinateSystemInit(CoordinateSystem* cs); void createCS(CoordinateSystem* cs); void plotInt(CoordinateSystem* cs, int* data, int len, int color); void plotFloat(CoordinateSystem* cs, float* data, int len, int color); void dynamicPlotInt(CoordinateSystem* cs,QueueInt* queue,int color); void addInt(QueueInt* queue,int a); #endif // !DrawCoordinateSystemdrawCoordinateSystem.cpp #include "drawCoordinateSystem.h" #include // 引用图形库头文件 #include #include #include #include "queue.h" void coordinateSystemInit(CoordinateSystem* cs) { //图幅初始化 cs->length = 1280; cs->width = 780; //坐标轴初始化 cs->axis.xhigh = 100; cs->axis.xlow = -100; cs->axis.yhigh = 100; cs->axis.ylow = 0; cs->axis.centerx = (cs->axis.xhigh + cs->axis.xlow) / 2; cs->axis.centery = (cs->axis.yhigh + cs->axis.ylow) / 2; int len1 = cs->axis.xhigh - cs->axis.xlow; int len2 = cs->axis.yhigh - cs->axis.ylow; cs->axis.ax = cs->length*1.0 / len1; cs->axis.ay = cs->width*1.0 / len2; cs->axis.color = BLACK; //坐标原点初始化 cs->zerox = 0; cs->zeroy = 50; //刻度初始化 cs->scale.openflag = 1; cs->scale.scalex = 10; cs->scale.scaley = 10; cs->scale.color = BLACK; //网格初始化 cs->grid.openflag = 1; cs->grid.color = BLACK; //边界空出范围 cs->borderx = 10; cs->brodery = 10; cs->color = WHITE; //创建窗口 HWND hwnd = initgraph(cs->length + cs->borderx, cs->width + cs->brodery, EW_SHOWCONSOLE); setrop2(R2_MASKPEN); //加一个光栅更好看 } int transX(CoordinateSystem* cs, float x) { x -= cs->axis.centerx; x *= cs->axis.ax; int k = x; if (x - k > 0.5) k++; return k; } int transY(CoordinateSystem* cs, float y) { y -= cs->axis.centery; y *= cs->axis.ay; int k = y; if (y - k > 0.5) k++; return k; } void createCS(CoordinateSystem* cs) { //设置原点 int avex = (cs->length + cs->borderx) / 2; int avey = (cs->width + cs->brodery) / 2; setorigin(avex, avey); //设置缩放与坐标轴方向 setaspectratio(1,-1); //将y轴翻转为 向上为正 //设置背景色 setbkcolor(cs->color); cleardevice(); //绘制坐标轴 setlinecolor(cs->axis.color); //设置颜色 setlinestyle(PS_SOLID,3); //线的样式:实线,宽度 line(-cs->length/2,0,cs->length/2,0); line(transX(cs,cs->zerox),cs->width/2, transX(cs, cs->zerox),-cs->width/2); //绘制箭头 float angle = 15/180.0*3.14159; //箭头角度 float len3 =20; float x11 = cs->zerox*1.0; float x12 = cs->zerox*1.0 + len3 * tan(angle)/cs->axis.ax; float x13 = cs->zerox*1.0 - len3 * tan(angle) / cs->axis.ax; float y11 = cs->axis.yhigh*1.0; float y12 = cs->axis.yhigh*1.0 - len3 / cs->axis.ay; float y13 = cs->axis.yhigh*1.0 - len3/cs->axis.ay; line(transX(cs,x11),cs->width/2,transX(cs, x12 ),cs->width/2-len3); line(transX(cs, x11), cs->width / 2, transX(cs, x13), cs->width / 2 - len3); float x21 = cs->axis.xhigh; float x22 = cs->axis.xhigh - len3 / cs->axis.ax; float x23 = cs->axis.xhigh - len3 / cs->axis.ax; float y21 = cs->zeroy; float y22 = cs->zeroy+len3* tan(angle) / cs->axis.ay; float y23 = cs->zeroy - len3 * tan(angle) / cs->axis.ay; line(transX(cs, x21), transY(cs, y21), transX(cs, x22), transY(cs, y22)); line(transX(cs, x21), transY(cs, y21), transX(cs, x23), transY(cs, y23)); // 绘制刻度 if (cs->scale.openflag) { int len4 = 5; //刻度的高度 float rlen = 50 / cs->axis.ax, rwid = 30 / cs->axis.ay; //刻度值长宽 int bias = 2; //刻度值离坐标轴的距离 char s[10]; int i = 0; setaspectratio(1, 1); //将y轴翻转为 向上为负 settextcolor(cs->scale.color); //设置文字颜色 setbkmode(TRANSPARENT); //背景透明 while (cs->zerox - i * cs->scale.scalex > cs->axis.xlow) { setlinecolor(cs->axis.color); //设置刻度颜色 setlinestyle(PS_SOLID, 3); //线的样式:实线,宽度 line(transX(cs, cs->zerox - i * cs->scale.scalex), transY(cs, cs->zeroy), transX(cs, cs->zerox - i * cs->scale.scalex), transY(cs, cs->zeroy) - len4); RECT r = { transX(cs, cs->zerox - i * cs->scale.scalex - rlen / 2), transY(cs, cs->zeroy) + bias,transX(cs, cs->zerox - i * cs->scale.scalex + rlen / 2),transY(cs, cs->zeroy + rwid) + bias }; sprintf(s, "%d", cs->zerox - i * cs->scale.scalex); // printf("%s\n", s); drawtext(s, &r, DT_CENTER | DT_TOP | DT_SINGLELINE); //绘制网格 if (cs->grid.openflag&&i!=0) { setlinecolor(cs->grid.color); //设置网格颜色 setlinestyle(PS_DASH, 1); //线的样式:虚线,宽度 line(transX(cs, cs->zerox - i * cs->scale.scalex), transY(cs, cs->axis.ylow), transX(cs, cs->zerox - i * cs->scale.scalex), transY(cs, cs->axis.yhigh)); } i++; } i = 1; while (cs->zerox + i * cs->scale.scalex < cs->axis.xhigh) { setlinecolor(cs->axis.color); //设置刻度颜色 setlinestyle(PS_SOLID, 3); //线的样式:实线,宽度 line(transX(cs, cs->zerox + i * cs->scale.scalex), transY(cs, cs->zeroy), transX(cs, cs->zerox + i * cs->scale.scalex), transY(cs, cs->zeroy) - len4); RECT r = { transX(cs, cs->zerox + i * cs->scale.scalex - rlen / 2), transY(cs, cs->zeroy) + bias,transX(cs, cs->zerox + i * cs->scale.scalex + rlen / 2),transY(cs, cs->zeroy + rwid) + bias }; sprintf(s, "%d", cs->zerox + i * cs->scale.scalex); // printf("%s\n", s); drawtext(s, &r, DT_CENTER | DT_TOP | DT_SINGLELINE); //绘制网格 if (cs->grid.openflag&&i != 0) { setlinecolor(cs->grid.color); //设置网格颜色 setlinestyle(PS_DASH, 1); //线的样式:虚线,宽度 line(transX(cs, cs->zerox + i * cs->scale.scalex), transY(cs, cs->axis.ylow), transX(cs, cs->zerox + i * cs->scale.scalex), transY(cs, cs->axis.yhigh)); } i++; } i = 0; while (cs->zeroy - i * cs->scale.scaley > cs->axis.ylow) { setlinecolor(cs->axis.color); //设置刻度颜色 setlinestyle(PS_SOLID, 3); //线的样式:实线,宽度 line(transX(cs, cs->zerox), transY(cs, cs->zeroy + i * cs->scale.scaley), transX(cs, cs->zerox) + len4, transY(cs, cs->zeroy + i * cs->scale.scaley)); RECT r = { transX(cs, cs->zerox - rlen) - bias, transY(cs,cs->zeroy + i * cs->scale.scaley - rwid / 2),transX(cs, cs->zerox) - bias, transY(cs,cs->zeroy + i * cs->scale.scaley + rwid / 2) }; sprintf(s, "%d", cs->zeroy - i * cs->scale.scaley); // printf("%s\n", s); drawtext(s, &r, DT_RIGHT | DT_VCENTER | DT_SINGLELINE); //绘制网格 if (cs->grid.openflag&&i != 0) { setlinecolor(cs->grid.color); //设置网格颜色 setlinestyle(PS_DASH, 1); //线的样式:虚线,宽度 line(transX(cs, cs->axis.xlow), transY(cs, cs->zeroy + i * cs->scale.scaley), transX(cs, cs->axis.xhigh), transY(cs, cs->zeroy + i * cs->scale.scaley)); } i++; } i = 1; while (cs->zeroy + i * cs->scale.scaley < cs->axis.yhigh) { setlinecolor(cs->axis.color); //设置刻度颜色 setlinestyle(PS_SOLID, 3); //线的样式:实线,宽度 line(transX(cs, cs->zerox), transY(cs, cs->zeroy - i * cs->scale.scaley), transX(cs, cs->zerox) + len4, transY(cs, cs->zeroy - i * cs->scale.scaley)); RECT r = { transX(cs, cs->zerox - rlen) - bias, transY(cs,cs->zeroy - i * cs->scale.scaley - rwid / 2),transX(cs, cs->zerox) - bias, transY(cs,cs->zeroy - i * cs->scale.scaley + rwid / 2) }; sprintf(s, "%d", cs->zeroy + i * cs->scale.scaley); // printf("%s\n", s); drawtext(s, &r, DT_RIGHT | DT_VCENTER | DT_SINGLELINE); //绘制网格 if (cs->grid.openflag&&i != 0) { setlinecolor(cs->grid.color); //设置网格颜色 setlinestyle(PS_DASH, 1); //线的样式:虚线,宽度 line(transX(cs, cs->axis.xlow), transY(cs, cs->zeroy - i * cs->scale.scaley), transX(cs, cs->axis.xhigh), transY(cs, cs->zeroy - i * cs->scale.scaley)); } i++; } } } void setRange(CoordinateSystem*cs, int xlow, int xhigh, int ylow, int yhigh) { cs->axis.ylow = ylow; cs->axis.yhigh = yhigh; cs->axis.xlow = xlow; cs->axis.xhigh = xhigh; cs->axis.centerx = (cs->axis.xlow + cs->axis.xhigh) / 2; cs->axis.centery = (cs->axis.ylow + cs->axis.yhigh) / 2; int len1 = cs->axis.xhigh - cs->axis.xlow; int len2 = cs->axis.yhigh - cs->axis.ylow; cs->axis.ax = cs->length*1.0 / len1; cs->axis.ay = cs->width*1.0 / len2; cs->scale.scalex =(int) (100 / cs->axis.ax)/10*10; cs->scale.scaley = (int)(100 / cs->axis.ay) / 10*10; if (cs->scale.scalex scale.scalex=(int)(100 / cs->axis.ax); if (cs->scale.scaley scale.scaley=(int)(100 / cs->axis.ay); if (cs->scale.scalex scale.scalex = 1; if (cs->scale.scaley scale.scaley = 1; cs->zerox = 0; cs->zeroy = cs->axis.centery; } //直接给一组数据,将数据绘制出来 void plotInt(CoordinateSystem* cs, int* data, int len, int color) { //找出最大最小值 int min = data[0]; int max = data[0]; for (int i = 1; i < len; i++) { if (data[i] > max) { max = data[i]; } if (data[i] < min) { min = data[i]; } } int range = max - min; coordinateSystemInit(cs); setRange(cs, 0-len*0.1, len*1.1, min-range*0.1, max+range*0.1); createCS(cs); setlinecolor(color); setaspectratio(1, -1); setlinestyle(PS_SOLID, 2); for (int i = 0; i < len - 1; i++) { line(transX(cs,i + 1),transY(cs, data[i]),transX(cs, i + 2),transY(cs, data[i + 1])); } for (int i = 0; i < len; i++) { putpixel(transX(cs,i + 1),transY(cs, data[i]),color); } } //直接给一组数据,将数据绘制出来 void plotFloat(CoordinateSystem* cs, float* data, int len, int color) { //找出最大最小值 float min = data[0]; float max = data[0]; for (int i = 1; i < len; i++) { if (data[i] > max) { max = data[i]; } if (data[i] < min) { min = data[i]; } } float range = max - min; coordinateSystemInit(cs); setRange(cs, 0 - len * 0.1, len*1.1, min - range * 0.1, max + range * 0.1); createCS(cs); setlinecolor(color); setaspectratio(1, -1); setlinestyle(PS_SOLID, 2); for (int i = 0; i < len - 1; i++) { line(transX(cs, i + 1), transY(cs, data[i]), transX(cs, i + 2), transY(cs, data[i + 1])); } for (int i = 0; i < len; i++) { putpixel(transX(cs, i + 1), transY(cs, data[i]), color); } // } void dynamicPlotInt(CoordinateSystem* cs, QueueInt* queue, int color) { int len = getSizeInt(queue); int min, max; if (len == 0) { min = 0; max = 100; }else if (len==1) { min = queue->data[queue->front] - 10; max = queue->data[queue->front] + 10; }else { int p = (queue->front+1)%MAXSIZE; min = queue->data[queue->front]; max = queue->data[queue->front]; while (p% MAXSIZE != queue->rear) { if (queue->data[p ]>max) { max = queue->data[p ]; } if (queue->data[p ] < min) { min = queue->data[p ]; } p++; p %= MAXSIZE; } } if (min == max) { min = min - 10; max = max + 10; } float range = max - min; // coordinateSystemInit(cs); if (len front; (p+1)%MAXSIZE != queue->rear;p++,p%=MAXSIZE,i++) { line(transX(cs, i + 1), transY(cs,queue->data[p]), transX(cs, i + 2), transY(cs, queue->data[(p+1)%MAXSIZE])); k++; if (k == 10) { // FlushBatchDraw(); k = 0; } } EndBatchDraw(); // i = 0; // for (int p = queue->front; p%MAXSIZE != queue->rear; p++, p %= MAXSIZE, i++) { // putpixel(transX(cs, i + 1), transY(cs, queue->data[p]), color); // } // for (int i = 0; i < len; i++) { // putpixel(transX(cs, i + 1), transY(cs, data[i]), color); // } } void addInt(QueueInt* queue, int a) { if (insertInt(queue, a)) { deleteInt(queue); insertInt(queue, a); } }最后是绘制代码 绘制静态数据代码: #include #include #include #include // 引用图形库头文件 #include #include "drawCoordinateSystem.h" #include "queue.h" int main() { CoordinateSystem cs; coordinateSystemInit(&cs); float a[1001]; int j = 0; for (float i = 0; i < 2 * 3.14; i += 3.14 / 500) { a[j++] = 10 * sin(i); } plotFloat(&cs, a, 1000, RED); getchar(); return 0; }绘制动态数据代码: #include #include #include #include #include // 引用图形库头文件 #include #include "drawCoordinateSystem.h" #include "queue.h" void fun(void* p) { CoordinateSystem cs; coordinateSystemInit(&cs); while (1) { dynamicPlotInt(&cs,&queue,RED); Sleep(20); } _endthread(); } int main(){ queueInitInt(&queue); _beginthread(fun, 0, NULL); float t = 0; getchar(); while (1) { if (int(t+1) % 500 == 0) { addInt(&queue, 100 * sin(t / 100)); }else addInt(&queue,100*sin(t/100)); Sleep(10); t++; printf("%d\n",getSizeInt(&queue)); } return 0; }这里动态绘制只写了绘制int类型的代码,float类型的其实也基本一样,复制一下就好,如果各位有需求,可以自己动手或评论或者私信,我来加上。 |
【本文地址】


