Mathematica里面Plot颜色画图小技巧 |
您所在的位置:网站首页 › 怎么改变曲线的颜色 › Mathematica里面Plot颜色画图小技巧 |
Mathematica里面Plot颜色画图小技巧
|
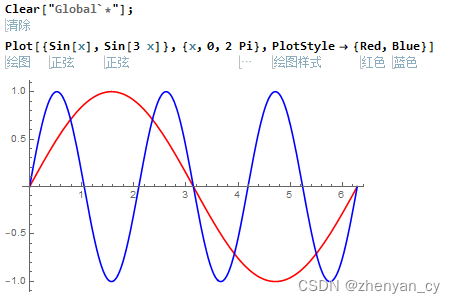
1.关于画图中曲线的颜色,粗细,虚实的 单一性的表示:颜色,或虚实,在PlotStyle中采用颜色或虚实,,直接使用PlotStyle -> {Red,Blue}或PlotStyle -> {Dashed, Thick} 示例1: Clear["Global`*"]; Plot[{Sin[x], Sin[3 x]}, {x, 0, 2 Pi}, PlotStyle -> {Red, Blue}]结果1:
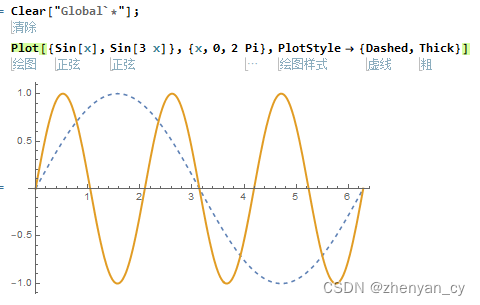
示例2: Clear["Global`*"]; Plot[{Sin[x], Sin[3 x]}, {x, 0, 2 Pi}, PlotStyle -> {Dashed, Thick}]结果2:
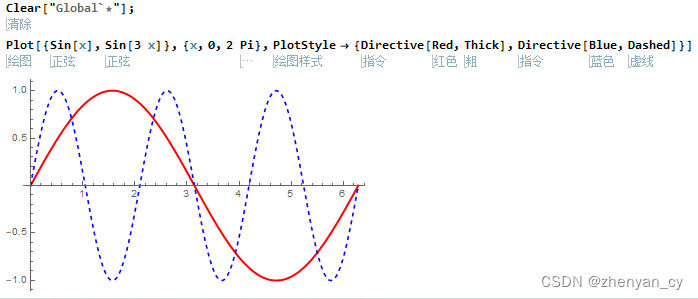
组合性的表示:颜色+虚实,在PlotStyle中采用Directive[Red, Dashed],使用PlotStyle -> {Directive[Red, Thick], Directive[Blue, Dashed]} 示例3: Clear["Global`*"]; Plot[{Sin[x], Sin[3 x]}, {x, 0, 2 Pi}, PlotStyle -> {Directive[Red, Thick], Directive[Blue, Dashed]}]结果3:
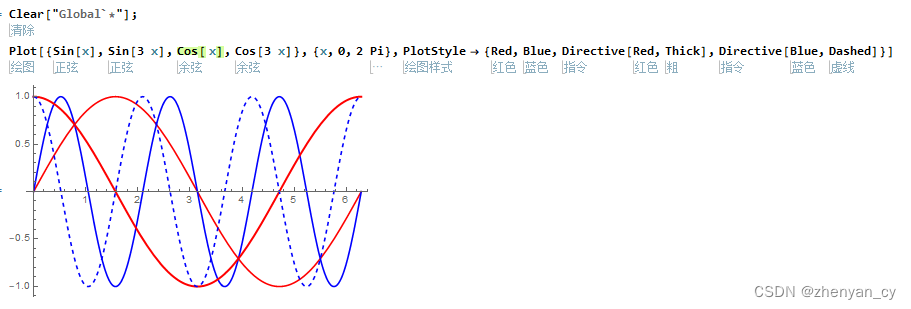
混合性表示:颜色以及颜色+虚实,使用PlotStyle -> {Red, Blue, Directive[Red, Thick], Directive[Blue, Dashed]} 示例4: Clear["Global`*"]; Plot[{Sin[x], Sin[3 x], Cos[ x], Cos[3 x]}, {x, 0, 2 Pi}, PlotStyle -> {Red, Blue, Directive[Red, Thick], Directive[Blue, Dashed]}]结果4:
|
【本文地址】