【Matlab】均值方差对比图 |
您所在的位置:网站首页 › 平均值和均方差 › 【Matlab】均值方差对比图 |
【Matlab】均值方差对比图
|
有些时候,为了对比不同情况下数据的均值和方差,我们可以使用表格法,但是表格法的确定在于不够直观,其实,可以利用Matlab绘图帮助我们快速而准确地表达出我们想要表达的意思。 若情况的个数比较少,那么我们可以使用箱线图表示数据的均值和方差;
箱线图又称为盒图,利用matlab的boxplot函数可以很方便地画出上面的效果: boxplot(randn(30,3)); 若情况的个数过多,那么我们可以采用如下的图来对比数据在不同情况下的均值和方差。
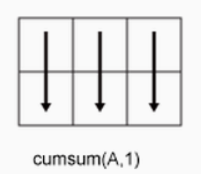
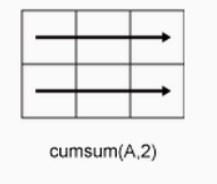
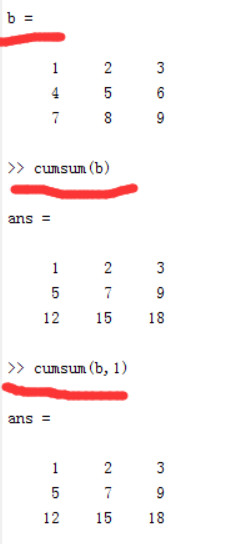
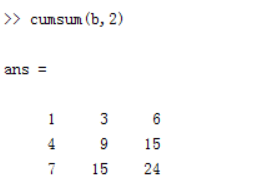
以下源码来自于MathWorks: function [h]=stdshade(amatrix,alpha,acolor,F,smth) % usage: stdshading(amatrix,alpha,acolor,F,smth) % plot mean and sem/std coming from a matrix of data, at which each row is an % observation. sem/std is shown as shading. % - acolor defines the used color (default is red) % - F assignes the used x axis (default is steps of 1). % - alpha defines transparency of the shading (default is no shading and black mean line) % - smth defines the smoothing factor (default is no smooth) % smusall 2010/4/23 if exist('acolor','var')==0 || isempty(acolor) acolor='r'; end if exist('F','var')==0 || isempty(F) F=1:size(amatrix,2); end if exist('smth','var'); if isempty(smth); smth=1; end else smth=1; %no smoothing by default end if ne(size(F,1),1) F=F'; end amean = nanmean(amatrix,1); %get man over first dimension if smth > 1 amean = boxFilter(nanmean(amatrix,1),smth); %use boxfilter to smooth data end astd = nanstd(amatrix,[],1); % to get std shading % astd = nanstd(amatrix,[],1)/sqrt(size(amatrix,1)); % to get sem shading if exist('alpha','var')==0 || isempty(alpha) fill([F fliplr(F)],[amean+astd fliplr(amean-astd)],acolor,'linestyle','none'); acolor='k'; else fill([F fliplr(F)],[amean+astd fliplr(amean-astd)],acolor, 'FaceAlpha', alpha,'linestyle','none'); end if ishold==0 check=true; else check=false; end hold on; h=plot(F,amean,acolor,'linewidth',1.5); %% change color or linewidth to adjust mean line if check hold off; end end function dataOut = boxFilter(dataIn, fWidth) % apply 1-D boxcar filter for smoothing dataStart = cumsum(dataIn(1:fWidth-2),2); dataStart = dataStart(1:2:end) ./ (1:2:(fWidth-2)); dataEnd = cumsum(dataIn(length(dataIn):-1:length(dataIn)-fWidth+3),2); dataEnd = dataEnd(end:-2:1) ./ (fWidth-2:-2:1); dataOut = conv(dataIn,ones(fWidth,1)/fWidth,'full'); dataOut = [dataStart,dataOut(fWidth:end-fWidth+1),dataEnd]; end下面介绍一个实例: h = figure; hold on; x = cumsum(randn(10,95),2); y = cumsum(randn(10,95),2)*2; z = cumsum(rand(10,95),2)/2; h1 = stdshade(x,0.5,'b'); h2 = stdshade(y,0.5,'r'); h3 = stdshade(z,0.5,'g'); axis square; legend([h1,h2,h3],{'A','B','C'}); xlim([1 95]);其中,需要注意的是,cumsum函数是一个计算元素累加的函数,cumsum累加函数默认是按列进行计算的,如下所示: 如果想按行累加,就将1变为2,依次类推,cumsum的第二个参数可以将数据中任意一个维度的值相累加
需要注意的是,返回结果的维度不发生变化,累加计算过程如下:
|


【本文地址】