使用python matplotlib画二维图,设置坐标轴刻度和colorbar刻度ticks |
您所在的位置:网站首页 › 坐标轴刻度单位怎么设置 › 使用python matplotlib画二维图,设置坐标轴刻度和colorbar刻度ticks |
使用python matplotlib画二维图,设置坐标轴刻度和colorbar刻度ticks
|
文章目录
导入包数据准备画图令xy坐标刻度用科学计数法表示控制刻度间隔刻度字体大小添加colorbar并设置刻度完整代码
导入包
import numpy as np
import matplotlib.pyplot as plt
import matplotlib.colors as mcolors
from matplotlib.ticker import (MultipleLocator, FormatStrFormatter, AutoMinorLocator)
数据准备
xi = np.linspace(-50000, 50000, 500)#从-50000到50000等间隔采样500个点构建1D数组
yi = np.linspace(-50000, 50000, 500)#从-50000到50000等间隔采样500个点构建1D数组
#从1D坐标得到2D网格坐标
X,Y=np.meshgrid(xi,yi)
#合成数据
Z=np.sin(1e-8*X*Y)*np.exp(-1e-8*X**2-1e-8*Y**2)
#自定义色标
colors=["magenta","blueviolet","royalblue","aqua","springgreen","greenyellow","yellow","orangered","red","white"]
clrmap=mcolors.LinearSegmentedColormap.from_list("mycmap",colors)
画图
#开始绘制
#图片宽度6, 高4,单位inch
fig=plt.figure(figsize=(6,4))
plt.pcolor(X,Y,Z,cmap=clrmap)
#令xy的尺度相同
plt.gca().set_aspect('equal', 'box')
#设置xy轴标签
plt.gca().set_xlabel("x (cm)",fontsize=12.5)
plt.gca().set_ylabel("y (cm)",fontsize=12.5)
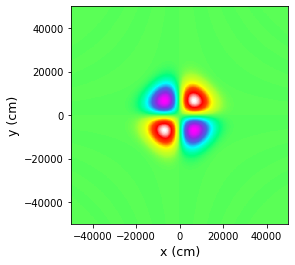
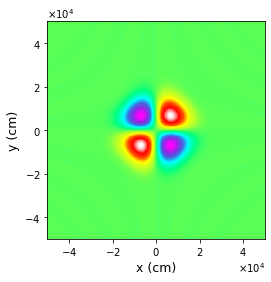
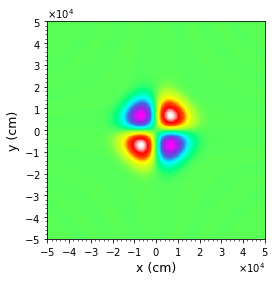
到此,得下图 使用matplotlib.axes.Axes.ticklabel_format来控制坐标刻度格式。 用法:ticklabel_format(style='scientific',scilimits=(m,n),useMathText=False) scilimits=(m,n)表示如果刻度范围超出 1 0 m 10^m 10m到 1 0 n 10^n 10n,那么就是用科学计数法。如果将scilimits参数设为(0,0),那么对于所有的刻度范围都自动显示成科学计数的形式。令useMathText=False的时候,会显示为 1 e X 1eX 1eX的形式,useMathText=True的时候,会显示成 1 0 X 10^X 10X的形式。 官方文档:https://matplotlib.org/api/_as_gen/matplotlib.axes.Axes.ticklabel_format.html#matplotlib.axes.Axes.ticklabel_format在前面的画图代码继续敲下面这行: #xy坐标刻度使用科学计数法 plt.gca().ticklabel_format(style='scientific',scilimits=(-2,2),useMathText=True)得到下图 继续上述的实例 #设置主刻度 major ticks和副刻度minor ticks #使用MultipleLocator(10000)设置主刻度的间隔为10000 plt.gca().xaxis.set_major_locator(MultipleLocator(10000)) plt.gca().yaxis.set_major_locator(MultipleLocator(10000)) #自动设置副刻度的间隔 plt.gca().xaxis.set_minor_locator(AutoMinorLocator()) plt.gca().yaxis.set_minor_locator(AutoMinorLocator())运行得到 得下图 给图片添加颜色条,并且设置颜色条的刻度 #添加颜色条 clb=plt.colorbar() #设置颜色条的刻度 clb.ax.yaxis.set_major_locator(MultipleLocator(0.025)) clb.ax.yaxis.set_minor_locator(MultipleLocator(0.005)) clb.ax.tick_params(labelsize=12.5) #设置颜色条的title clb.ax.set_title('unit',fontsize=12.5)
完整代码如下: # -*- coding: utf-8 -*- import numpy as np import matplotlib.pyplot as plt import matplotlib.colors as mcolors from matplotlib.ticker import (MultipleLocator, FormatStrFormatter, AutoMinorLocator) #产生数据 #从-50000到50000等间隔采样500个点 xi = np.linspace(-50000, 50000, 500) yi = np.linspace(-50000, 50000, 500) #从一维数组得到二维数组 X,Y=np.meshgrid(xi,yi) Z=np.sin(1e-8*X*Y)*np.exp(-1e-8*X**2-1e-8*Y**2) #自定义色标 colors=["magenta","blueviolet","royalblue","aqua","springgreen","greenyellow","yellow","orangered","red","white"] clrmap=mcolors.LinearSegmentedColormap.from_list("mycmap",colors) #开始绘制 #图片宽度6, 高4,单位inch fig=plt.figure(figsize=(6,4)) plt.pcolor(X,Y,Z,cmap=clrmap) #令xy的尺度相同 plt.gca().set_aspect('equal', 'box') #设置xy轴标签 plt.gca().set_xlabel("x (cm)",fontsize=12.5) plt.gca().set_ylabel("y (cm)",fontsize=12.5) #xy坐标刻度使用科学计数法 plt.gca().ticklabel_format(style='scientific',scilimits=(-2,2),useMathText=True) #设置主刻度 major ticks和副刻度minor ticks #使用MultipleLocator(10000)设置主刻度的间隔为10000 plt.gca().xaxis.set_major_locator(MultipleLocator(10000)) plt.gca().yaxis.set_major_locator(MultipleLocator(10000)) #自动设置副刻度的间隔 plt.gca().xaxis.set_minor_locator(AutoMinorLocator()) plt.gca().yaxis.set_minor_locator(AutoMinorLocator()) #设置刻度的字体大小,axis='both'表示major和minor ticks一起设置 plt.gca().tick_params(which='both',labelsize=12.5) #下面两句设置x轴和y轴科学计数法部分(即x10^(4))的字体 plt.gca().xaxis.get_offset_text().set_fontsize(12.5) plt.gca().yaxis.get_offset_text().set_fontsize(12.5) #添加颜色条 clb=plt.colorbar() #设置颜色条的刻度 clb.ax.yaxis.set_major_locator(MultipleLocator(0.025)) clb.ax.yaxis.set_minor_locator(MultipleLocator(0.005)) clb.ax.tick_params(labelsize=12.5) #设置颜色条的title clb.ax.set_title('unit',fontsize=12.5) plt.show() |


【本文地址】
今日新闻 |
推荐新闻 |