python手动实现图像像素的kmeans聚类(附代码) |
您所在的位置:网站首页 › 图像分割kmeans › python手动实现图像像素的kmeans聚类(附代码) |
python手动实现图像像素的kmeans聚类(附代码)
|
1.简介
这篇文章主要是介绍了python使用kmeans算法来对图像中的像素进行聚类。整个kmeans算法为手动实现,不调用sklearn库。一共使用了两种方法,其中方法a.py使用了三通道像素值rgb共三个特征,方法b.py使用了rgb+像素坐标xy共5个特征。 2.kmeanskmeans步骤共可分为以下步骤: 随机初始化k个聚类中心。 计算所有像素点到聚类中心的距离。 选择最近的聚类中心作为像素点的聚类种类。 根据像素点的聚类种类更新聚类中心。 重复步骤2-4直至聚类中心收敛。 3.代码部分关键代码: # 提取图像的像素值 features = [] for y in range(height): for x in range(width): features.append(image[y, x, :] / 255) features = np.array(features) # 初始化聚类中心 kmeans_centers = features[np.random.choice(len(features), k), :] kmeans_centers = np.array(kmeans_centers) # 计算所有像素点到聚类中心的距离矩阵 def euclidean_dist(X, Y): Gx = np.matmul(X, X.T) Gy = np.matmul(Y, Y.T) diag_Gx = np.reshape(np.diag(Gx), (-1, 1)) diag_Gy = np.reshape(np.diag(Gy), (-1, 1)) return diag_Gx + diag_Gy.T - 2 * np.matmul(X, Y.T) # 更新聚类中心 new_kmeans_centers = [] for j in range(k): new_kmeans_centers.append(np.mean(features[segs==j, :], axis=0)) new_kmeans_centers = np.array(new_kmeans_centers)方法a完整代码: import numpy as np import matplotlib.pyplot as plt import matplotlib.image as mpimg if __name__ == '__main__': # Initialize rgb pixel values for each class in kmeans using specific values bgr_list = [(0, 0, 255), (0, 255, 0), (255, 0, 0), (128, 128, 255), (128, 255, 128), (255, 128, 128), (128, 0, 255), (128, 255, 0), (255, 128, 0), (0, 128, 255), (0, 255, 128), (255, 0, 128)] # Reading images using matplotlib library image = mpimg.imread('demo.jpg') height, width, channel = image.shape # show original image plt.figure() plt.subplot(3, 3, 1) plt.axis('off') plt.title('Original') plt.imshow(image) # do kmeans segmentation for i, k in enumerate(range(5, 13, 1)): # extract bgr features features = [] for y in range(height): for x in range(width): features.append(image[y, x, :] / 255) features = np.array(features) # initial segments center using random value in features kmeans_centers = features[np.random.choice(len(features), k), :] kmeans_centers = np.array(kmeans_centers) # update while True: # calculate distance matrix def euclidean_dist(X, Y): Gx = np.matmul(X, X.T) Gy = np.matmul(Y, Y.T) diag_Gx = np.reshape(np.diag(Gx), (-1, 1)) diag_Gy = np.reshape(np.diag(Gy), (-1, 1)) return diag_Gx + diag_Gy.T - 2 * np.matmul(X, Y.T) dist_matrix = [] for start in range(0, len(features), 1000): dist_matrix.append(euclidean_dist(features[start:start+1000, :], kmeans_centers)) dist_matrix = np.concatenate(dist_matrix, axis=0) # dist_matrix = euclidean_dist(features, kmeans_centers) # get seg class for each sample segs = np.argmin(dist_matrix, axis=1) # update new kmeans center new_kmeans_centers = [] for j in range(k): new_kmeans_centers.append(np.mean(features[segs==j, :], axis=0)) new_kmeans_centers = np.array(new_kmeans_centers) # calculate whether converge if np.mean(abs(kmeans_centers - new_kmeans_centers)) < 0.1: break else: kmeans_centers = new_kmeans_centers # assign segs = segs.reshape(height, width) seg_result = np.zeros((height, width, channel), dtype=np.uint8) for y in range(height): for x in range(width): seg_result[y, x, :] = bgr_list[segs[y, x]] # show kmeans result plt.subplot(3, 3, i+2) plt.title('k={}'.format(k)) plt.axis('off') plt.imshow(seg_result) plt.savefig('result_a.jpg')方法b完整代码: import numpy as np import matplotlib.pyplot as plt import matplotlib.image as mpimg if __name__ == '__main__': # Initialize rgb pixel values for each class in kmeans using specific values bgr_list = [(0, 0, 255), (0, 255, 0), (255, 0, 0), (128, 128, 255), (128, 255, 128), (255, 128, 128), (128, 0, 255), (128, 255, 0), (255, 128, 0), (0, 128, 255), (0, 255, 128), (255, 0, 128)] # Reading images using matplotlib library image = mpimg.imread('demo.jpg') height, width, channel = image.shape # show original image plt.figure() plt.subplot(3, 3, 1) plt.axis('off') plt.title('Original') plt.imshow(image) # do kmeans segmentation for i, k in enumerate(range(5, 13, 1)): # extract bgr and location features features = [] for y in range(height): for x in range(width): features.append(np.concatenate((image[y, x, :] / 255, np.array([y / height, x / width])), axis=0)) features = np.array(features) # initial segments center using random value in features kmeans_centers = features[np.random.choice(len(features), k), :] kmeans_centers = np.array(kmeans_centers) # update while True: # calculate distance matrix def euclidean_dist(X, Y): Gx = np.matmul(X, X.T) Gy = np.matmul(Y, Y.T) diag_Gx = np.reshape(np.diag(Gx), (-1, 1)) diag_Gy = np.reshape(np.diag(Gy), (-1, 1)) return diag_Gx + diag_Gy.T - 2 * np.matmul(X, Y.T) dist_matrix = [] for start in range(0, len(features), 1000): dist_matrix.append(euclidean_dist(features[start:start+1000, :], kmeans_centers)) dist_matrix = np.concatenate(dist_matrix, axis=0) # dist_matrix = euclidean_dist(features, kmeans_centers) # get seg class for each sample segs = np.argmin(dist_matrix, axis=1) # update new kmeans center new_kmeans_centers = [] for j in range(k): new_kmeans_centers.append(np.mean(features[segs==j, :], axis=0)) new_kmeans_centers = np.array(new_kmeans_centers) # calculate whether converge if np.mean(abs(kmeans_centers - new_kmeans_centers)) < 0.1: break else: kmeans_centers = new_kmeans_centers # assign segs = segs.reshape(height, width) seg_result = np.zeros((height, width, channel), dtype=np.uint8) for y in range(height): for x in range(width): seg_result[y, x, :] = bgr_list[segs[y, x]] # show kmeans result plt.subplot(3, 3, i+2) plt.title('k={}'.format(k)) plt.axis('off') plt.imshow(seg_result) plt.savefig('result_b.jpg') 4.结果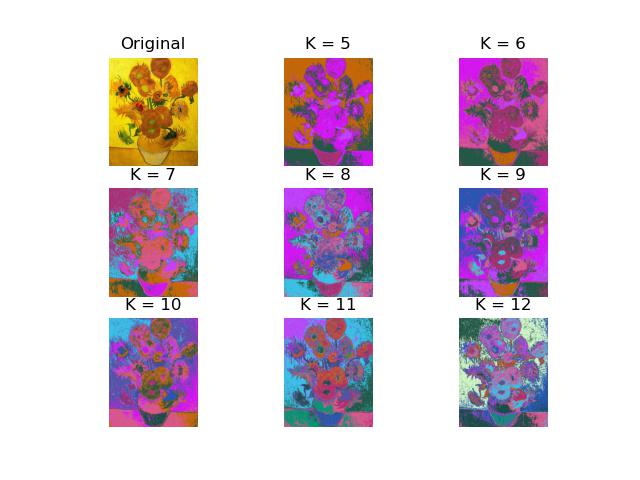
方法a结果 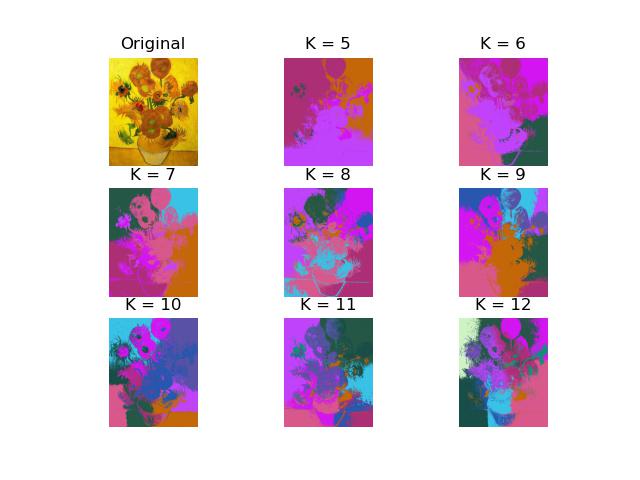
方法b结果 业务合作/学习交流+v:lizhiTechnology |
【本文地址】
今日新闻 |
推荐新闻 |