Bilibili动漫排行榜信息爬取分析 |
您所在的位置:网站首页 › 哔哩哔哩番剧排行榜 › Bilibili动漫排行榜信息爬取分析 |
Bilibili动漫排行榜信息爬取分析
|
Bilibili动漫排行榜信息爬取分析
(一)、选题的背景 互联网从发展到至今,已经深入到人们的日常生活中,并且不论老人还是小孩,多少都会接触到互联网。在这个越来越信息化的社会,互联网上的信息量更是爆炸式的增长,但是在如此巨大的信息量中,我们想要找到我们需要的价值信息就非常困难了。国内国外包含了很多搜索引擎,类似有搜狗,百度,360等等,我们如何有效的寻找具有价值的信息?网络爬虫应运而生,它可以帮助我们在繁琐的信息网中爬取出关键信息,而且可以一次性的爬取出来,省去了人力搜索。
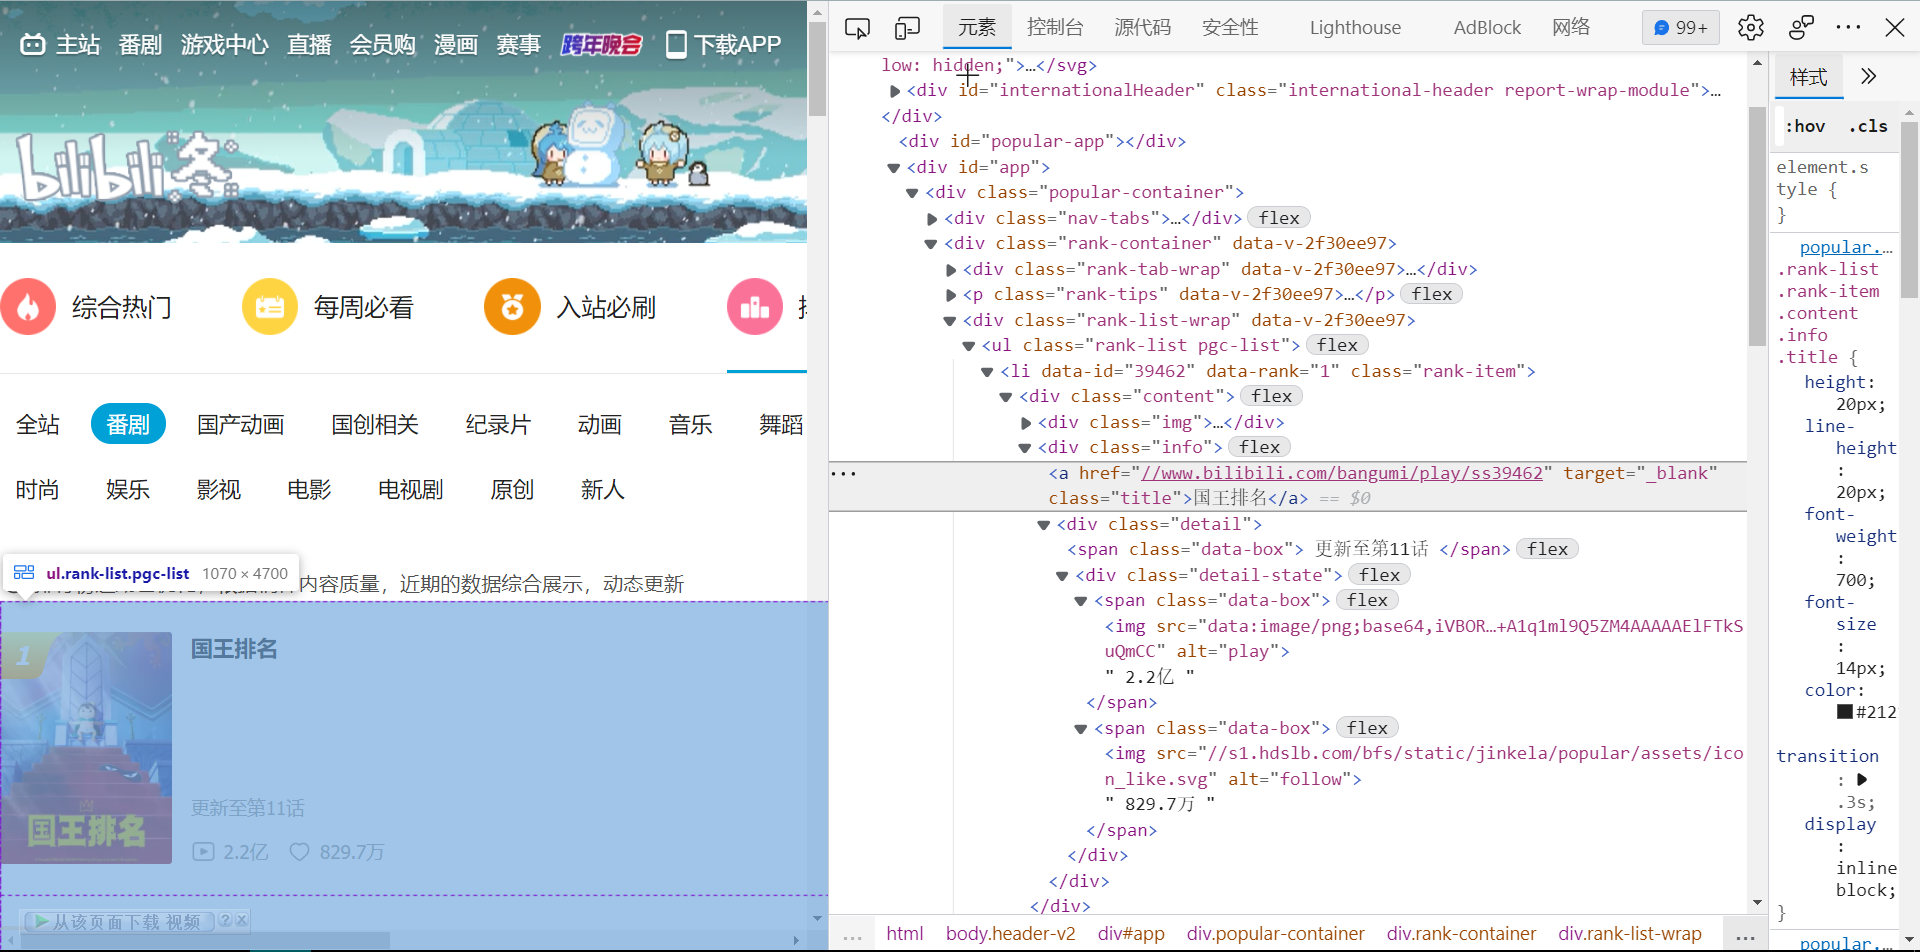
(二)、主题式网络爬虫设计方案 1.主题式网络爬虫名称 Bilibili动漫排行榜信息爬取分析 2.主题式网络爬虫爬取的内容与数据特征分析 爬取热门动漫番名、播放量、评论量、收藏量等信息,从而作出分析。 3.主题式网络爬虫设计方案概述 使用爬虫爬取 Bilibili动漫排行榜(哔哩哔哩排行榜 (bilibili.com)) 信息然对数据进行相应的处理,最后对处理后的数据进行可视化分析。 (三)、主题页面的结构特征分析 1.主题页面的结构与特征分析 爬取页面展示
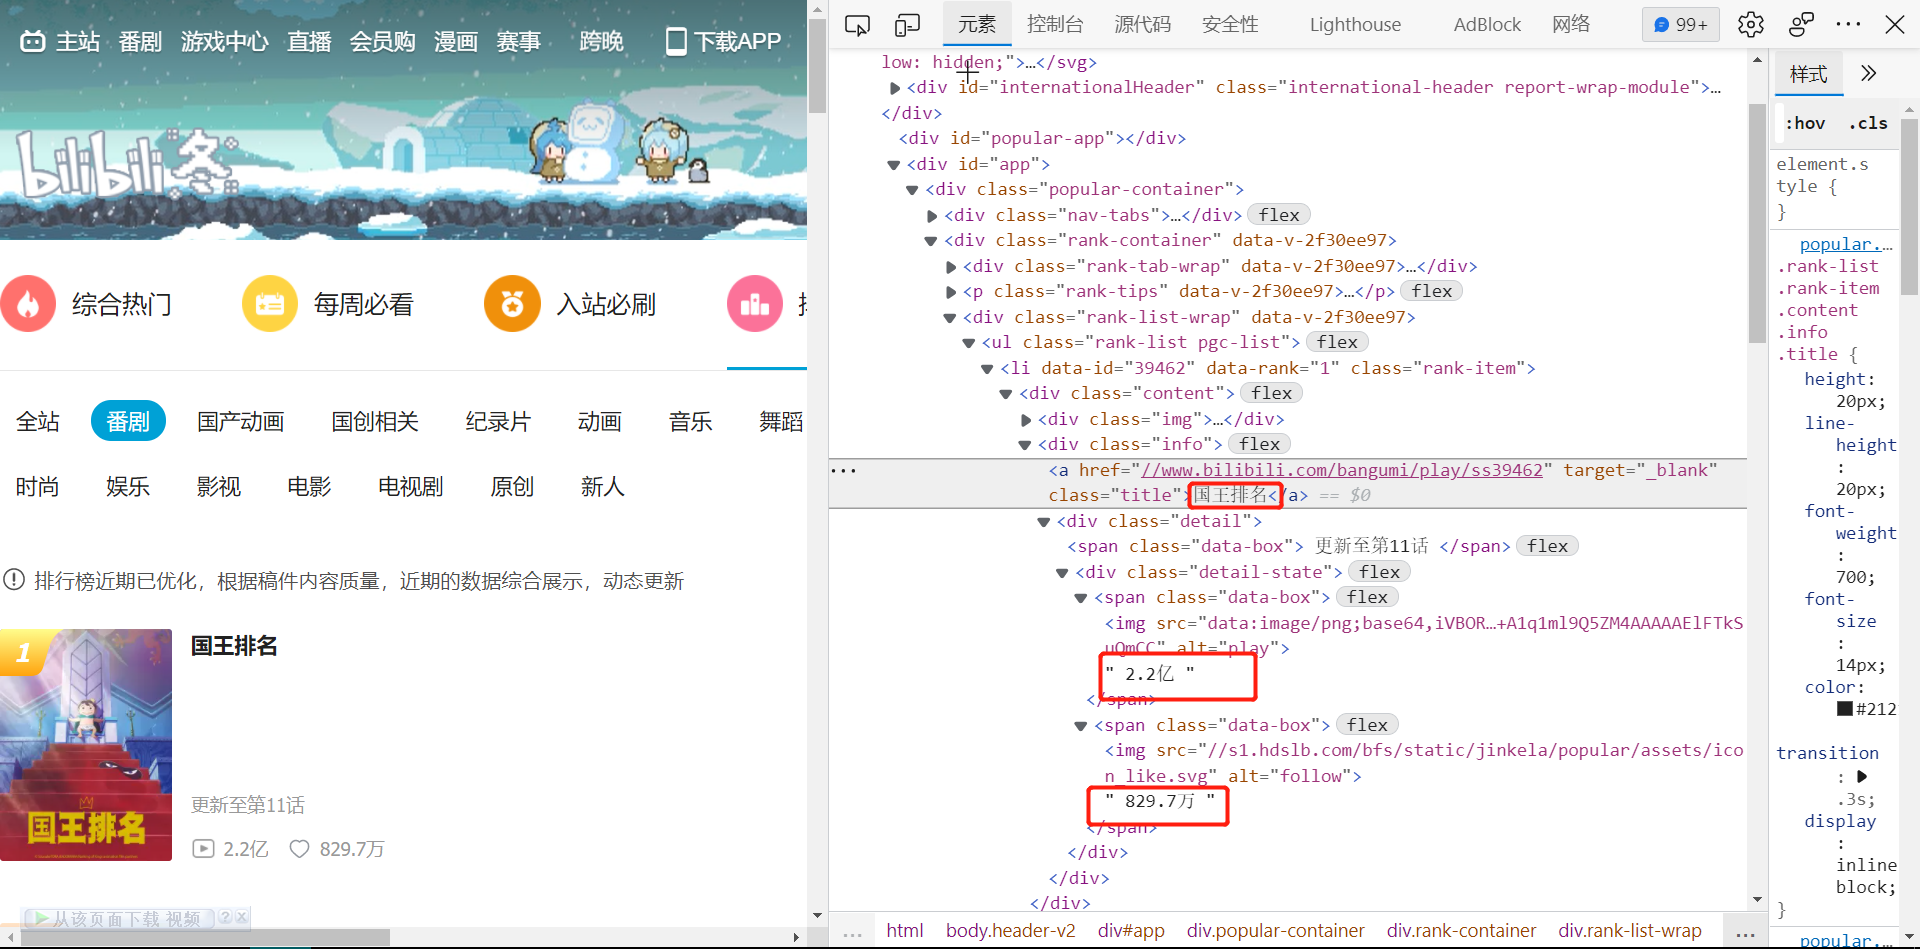
2.Htmls 页面解析 f12进入后,寻找所要信息
3.节点(标签)查找方法与遍历方法 找出他们对应的class名,之后使用for循环遍历这些标签,再进行输出
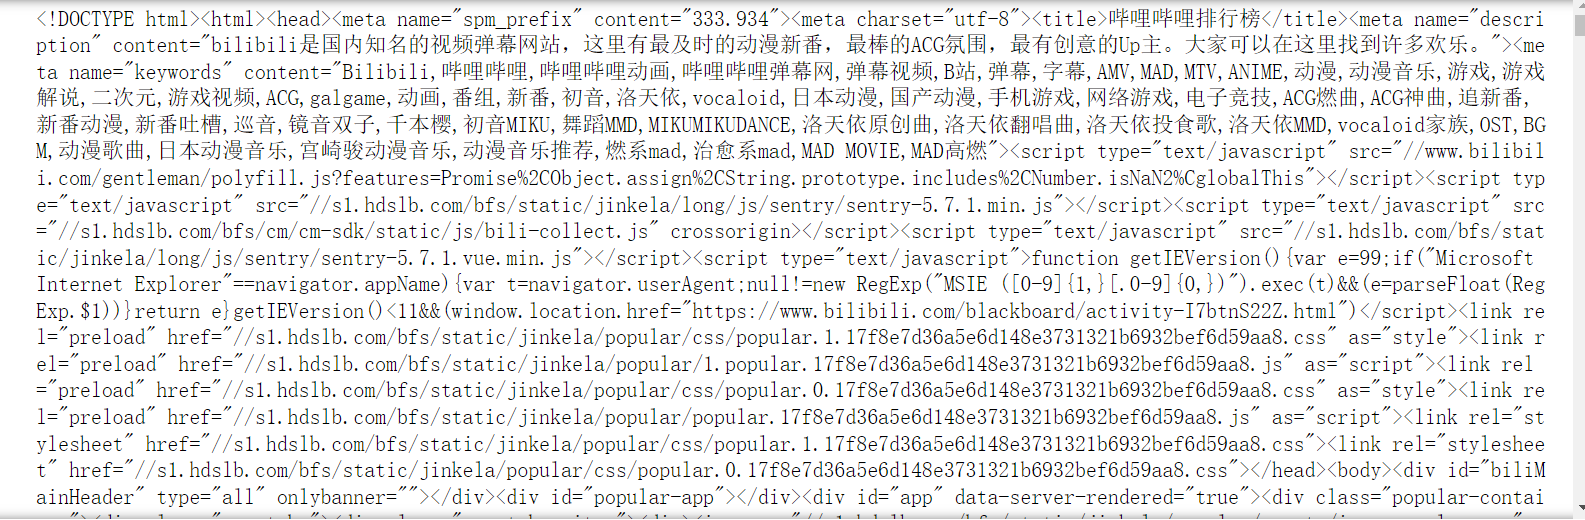
(四)、网络爬虫程序设计 爬虫程序主体要包括以下各部分,要附源代码及较详细注释,并在每部分程序后面提供输出结果的截图。 1.数据爬取与采集 1 # 导入相关库 2 import requests 3 import json 4 from bs4 import BeautifulSoup 5 6 def get_html(url): 7 try: 8 r = requests.get(url) # 使用get来获取网页数据 9 r.raise_for_status() # 如果返回参数不为200,抛出异常 10 r.encoding = r.apparent_encoding # 获取网页编码方式 11 return r.text # 返回获取的内容 12 except: 13 return '错误' 14 15 16 url = 'https://www.bilibili.com/v/popular/rank/bangumi' # 网址 17 html = get_html(url) # 获取返回值 18 print(html) # 打印
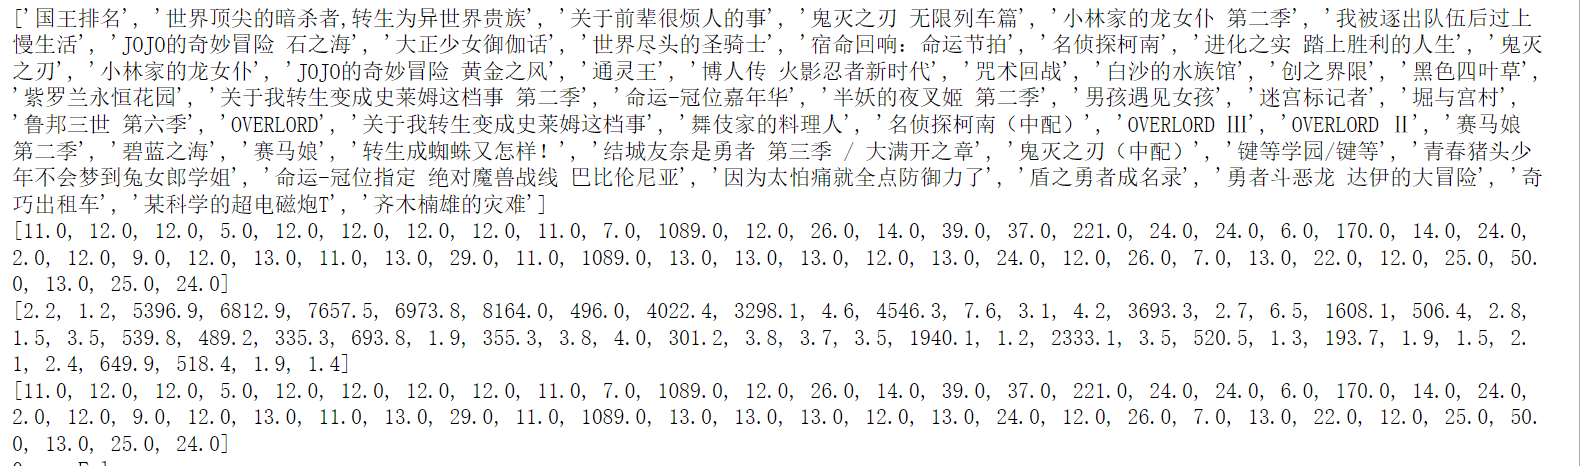
2.提取需要的数据,并保存为.xlsx 1 def save(html): 2 # 解析网页 3 soup = BeautifulSoup(html, 'html.parser') # 指定Beautiful的解析器为“html.parser” 4 5 # 定义好相关列表准备存储相关信息 6 name = [] # 动漫名字 7 bfl = [] # 播放量 8 pls = [] # 评论数 9 scs = [] # 收藏数 10 11 # 动漫名字存储 12 for tag in soup.find_all('div', class_='info'): 13 # print(tag) 14 bf = tag.a.string 15 name.append(str(bf)) 16 print(name) 17 18 # 播放量存储 19 for tag in soup.find_all('div', class_='detail'): 20 # print(tag) 21 bf = tag.find('span', class_='data-box').get_text() 22 # 统一单位为‘万’ 23 if '亿' in bf: 24 num = float(re.search(r'\d(.\d)?', bf).group()) * 10000 25 # print(num) 26 bf = num 27 else: 28 bf = re.search(r'\d*(\.)?\d', bf).group() 29 bfl.append(float(bf)) 30 print(bfl) 31 # 评论数存储 32 for tag in soup.find_all('div', class_='detail'): 33 # pl = tag.span.next_sibling.next_sibling 34 pl = tag.find('span', class_='data-box').next_sibling.next_sibling.get_text() 35 #统一单位 36 if '万' not in pl: 37 pl = '%.1f' % (float(pl) / 10000) 38 # print(123, pl) 39 else: 40 pl = re.search(r'\d*(\.)?\d', pl).group() 41 pls.append(float(pl)) 42 print(pls) 43 # 收藏数 44 for tag in soup.find_all('div', class_='detail'): 45 sc = tag.find('span', class_='data-box').get_text() 46 sc = re.search(r'\d*(\.)?\d', sc).group() 47 scs.append(float(sc)) 48 print(scs) 49 50 51 # 存储至excel表格中 52 info = {'动漫名': name, '播放量(万)': bfl, '评论数(万)': pls, '收藏数(万)': scs} 53 dm_file = pandas.DataFrame(info) 54 #查找重复值 55 #print(dm_file.duplicated()) 56 57 #查找缺少值 58 #print(dm_file.isnull()) 59 60 dm_file.to_excel('Dongman.xlsx', sheet_name="动漫数据分析") 61 # 将所有列表返回 62 return name, bfl, pls, scs, TScore
3.查找缺少/重复值 1 #查找重复值 2 #print(dm_file.duplicated()) 3 4 #查找缺少值 5 #print(dm_file.isnull())
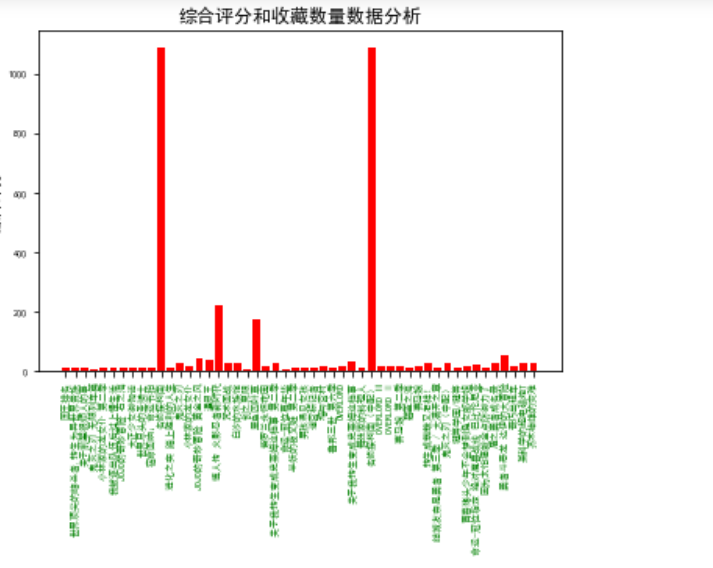
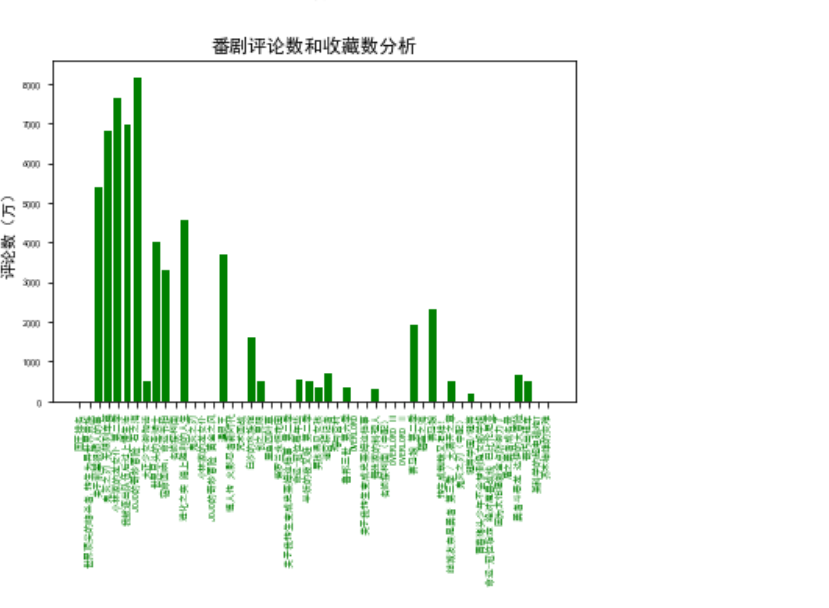
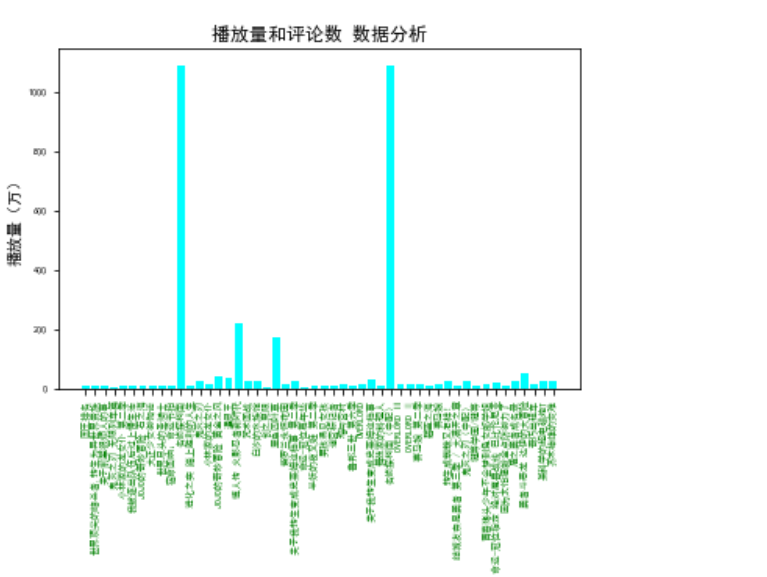
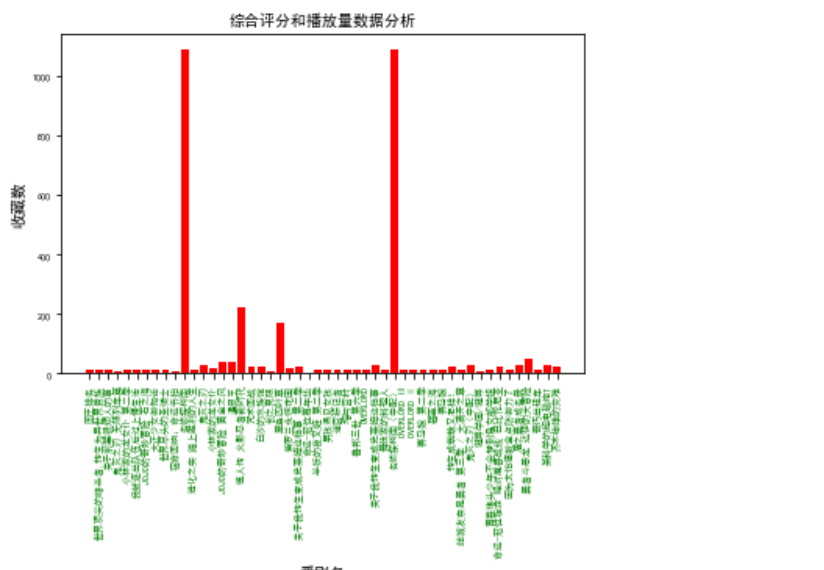
4.绘制条形图 1 def view(info): 2 my_font = font_manager.FontProperties(fname='./data/simhei.ttf') # 设置中文字体(图标中能显示中文) 3 dm_name = info[0] # 番剧名 4 dm_play = info[1] # 番剧播放量 5 dm_review = info[2] # 番剧评论数 6 dm_favorite = info[3] # 番剧收藏数 7 8 # 为了坐标轴上能显示中文 9 plt.rcParams['font.sans-serif'] = ['SimHei'] 10 plt.rcParams['axes.unicode_minus'] = False 11 12 13 # *******收藏数条形图 14 fig, ax1 = plt.subplots() 15 plt.bar(dm_name, dm_favorite, color='red') #设置柱状图 16 plt.title('综合评分和播放量数据分析', fontproperties=my_font) # 表标题 17 ax1.tick_params(labelsize=6) 18 plt.xlabel('番剧名') # 横轴名 19 plt.ylabel('收藏数') # 纵轴名 20 plt.xticks(rotation=90, color='green') # 设置横坐标变量名旋转度数和颜色 21 plt.show() 22 23 24 25 # 评论数条形图 26 fig, ax3 = plt.subplots() 27 plt.bar(dm_name, dm_review, color='green') 28 plt.title('番剧评论数和收藏数分析') 29 plt.ylabel('评论数(万)') 30 ax3.tick_params(labelsize=6) 31 plt.xticks(rotation=90, color='green') 32 plt.show() 33 34 35 # 综合评分条形图 36 fig, ax5 = plt.subplots() 37 plt.bar(dm_name, dm_favorite, color='red') 38 plt.title('综合评分和收藏数量数据分析') 39 plt.ylabel('综合评分') 40 ax5.tick_params(labelsize=6) 41 plt.xticks(rotation=90, color='green') 42 plt.show() 43 44 45 #播放量条形图 46 fig, ax7 = plt.subplots() 47 plt.bar(dm_name, dm_play, color='cyan') 48 plt.title('播放量和评论数 数据分析') 49 plt.ylabel('播放量(万)') 50 ax7.tick_params(labelsize=6) 51 plt.xticks(rotation=90, color='green') 52 plt.show() 53
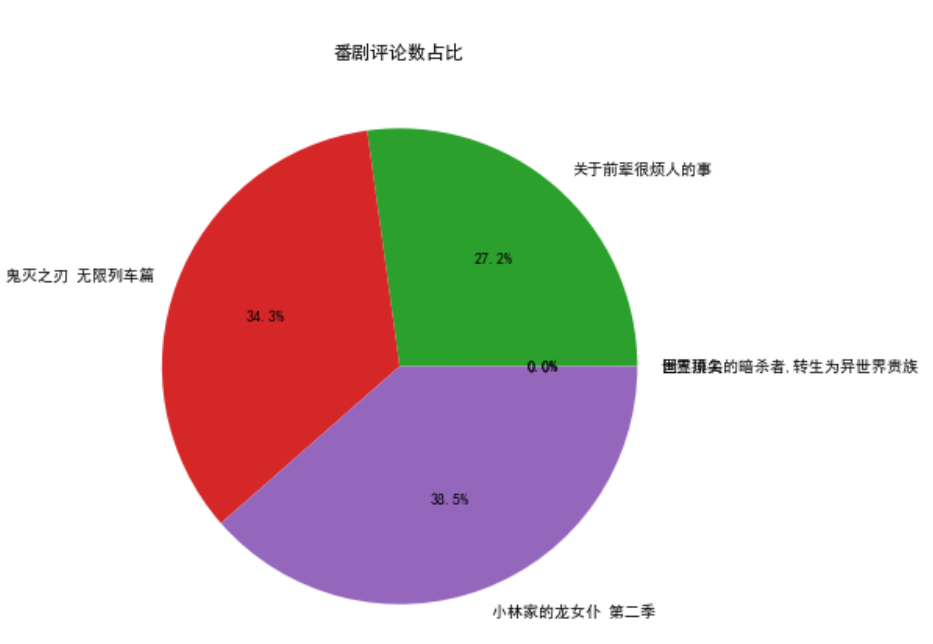
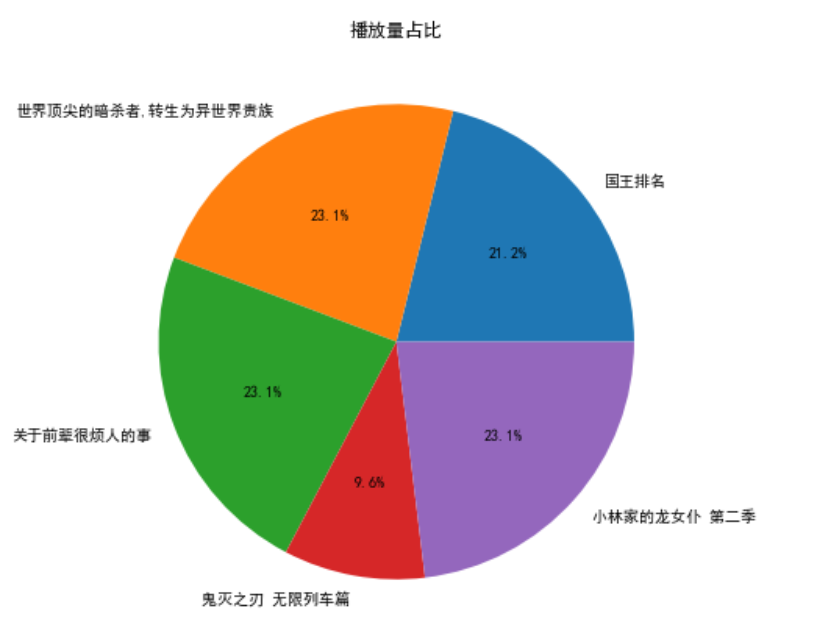
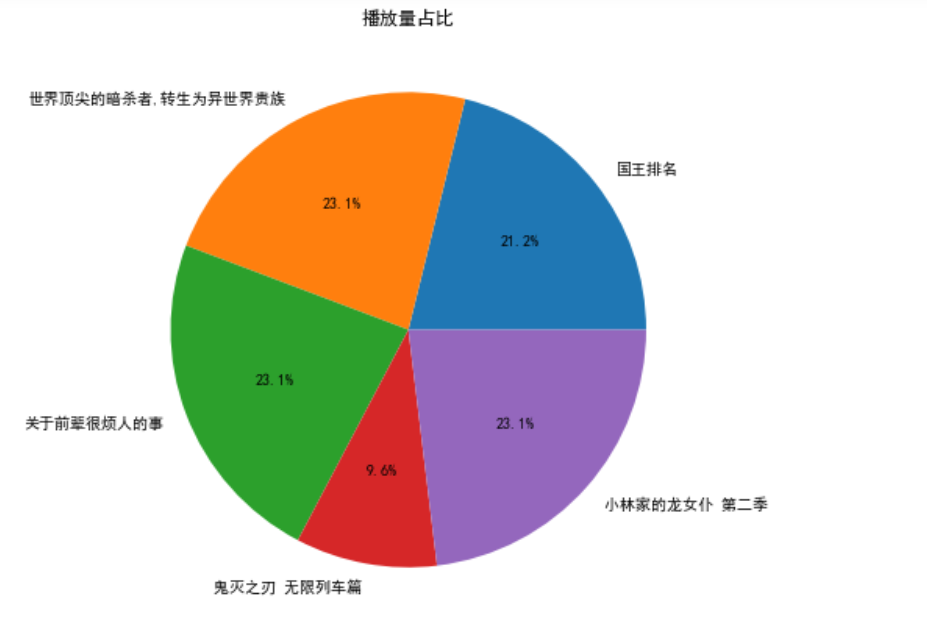
5.绘制饼图 1 #绘制播放量占比饼图 2 plt.figure(figsize=(7, 7)) 3 # 标签名 4 labels = dm_name[:5] 5 # 构造数据 6 data = dm_play[:5] 7 8 # 绘制图形 9 plt.pie(data, labels=labels, autopct='%1.1f%%') 10 plt.title('播放量占比') 11 plt.savefig('播放量占比.jpg') 12 plt.show() 13 14 # 绘制番剧评论数占比饼图 15 plt.figure(figsize=(7, 7)) 16 labels = dm_name[:5] 17 data = dm_review[:5] 18 19 plt.pie(data, labels=labels, autopct='%1.1f%%') 20 plt.title('番剧评论数占比') 21 plt.savefig('番剧评论数占比.jpg') 22 plt.show() 23 24 # 绘制番剧收藏数占比饼图 25 plt.figure(figsize=(7, 7)) 26 labels = dm_name[:5] 27 data = dm_favorite[:5] 28 29 plt.pie(data, labels=labels, autopct='%1.1f%%') 30 plt.title('番剧收藏数占比') 31 plt.savefig('番剧收藏数占比.jpg') 32 plt.show() 33 34
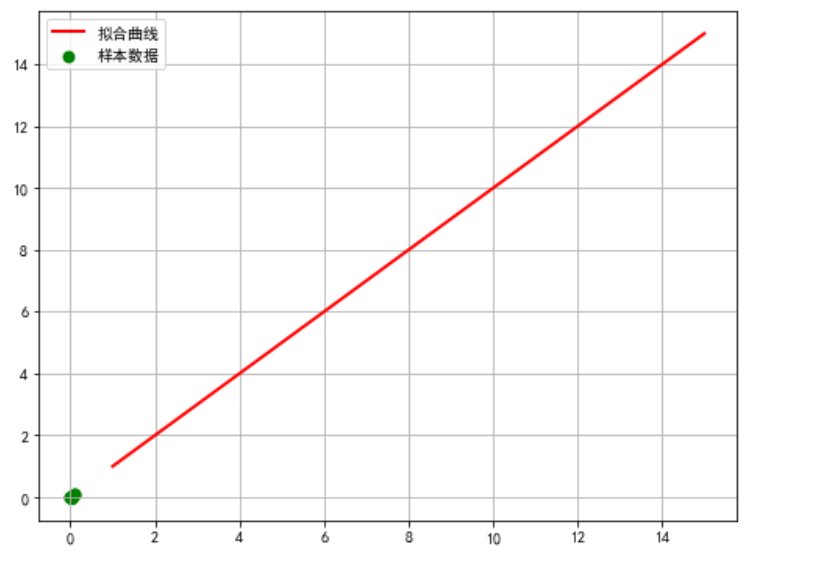
6.数据分析,回归方程 1 def rc(): 2 # 分析两组数据并画散点图和建立回归方程 3 # 设置中文字体 4 plt.rcParams['font.sans-serif'] = ['SimHei'] 5 6 # 嵌套函数 7 # 需要拟合的函数func,指定函数的形状 8 def func1(p, x): 9 a, b, c = p 10 return a * x * x + b * x + c 11 12 # 偏差函数 13 def error1(p, x, y): 14 return func1(p, x) - y 15 df = pd.DataFrame(pd.read_excel('Dongman.xlsx')) 16 # 画样本图像 17 plt.scatter(df['收藏数(万)'], df['播放量(万)']) 18 19 # 设置样本数据 20 X =df['收藏数(万)'] / 10000 21 Y = df['播放量(万)'] / 10000 22 plt.figure(figsize=(8, 6)) 23 24 # 设置函数拟合参数 25 p0 = [1, 15, 20] 26 27 # 进行最小二乘拟合 28 para = leastsq(error1, p0, args=(X, Y)) 29 a, b, c = para[0] 30 31 # 读取结果 32 print('a=', a, 'b=', b, 'c=', c) 33 print("求解的拟合直线为:") 34 print("y=" + str(round(a, 2)) + "x*x" + str(round(b, 2)) + "x+" + str(round(c, 2))) 35 36 # 画拟合曲线 37 plt.scatter(X, Y, color='green', label='样本数据', linewidth=2) 38 x = np.linspace(1, 15, 20) 39 y = a * x * x + b * x + c 40 plt.plot(x, y, color='red', label='拟合曲线', linewidth=2) 41 plt.legend() 42 plt.title('') 43 plt.grid() 44 plt.show() 45 46 rc()
7.数据持久化 1 #例如 2 plt.savefig('番剧收藏数占比.jpg')
8.完整代码 1 import re 2 import pandas 3 import requests 4 from bs4 import BeautifulSoup 5 import matplotlib.pyplot as plt 6 from matplotlib import font_manager 7 8 9 def get_html(url): 10 try: 11 r = requests.get(url) # 使用get来获取网页数据 12 r.raise_for_status() # 如果返回参数不为200,抛出异常 13 r.encoding = r.apparent_encoding # 获取网页编码方式 14 return r.text # 返回获取的内容 15 except: 16 return '错误' 17 18 19 def save(html): 20 # 解析网页 21 soup = BeautifulSoup(html, 'html.parser') # 指定Beautiful的解析器为“html.parser” 22 23 # 定义好相关列表准备存储相关信息 24 name = [] # 动漫名字 25 bfl = [] # 播放量 26 pls = [] # 评论数 27 scs = [] # 收藏数 28 29 # 动漫名字存储 30 for tag in soup.find_all('div', class_='info'): 31 # print(tag) 32 bf = tag.a.string 33 name.append(str(bf)) 34 print(name) 35 36 # 播放量存储 37 for tag in soup.find_all('div', class_='detail'): 38 # print(tag) 39 bf = tag.find('span', class_='data-box').get_text() 40 # 统一单位为‘万’ 41 if '亿' in bf: 42 num = float(re.search(r'\d(.\d)?', bf).group()) * 10000 43 # print(num) 44 bf = num 45 else: 46 bf = re.search(r'\d*(\.)?\d', bf).group() 47 bfl.append(float(bf)) 48 print(bfl) 49 # 评论数存储 50 for tag in soup.find_all('div', class_='detail'): 51 # pl = tag.span.next_sibling.next_sibling 52 pl = tag.find('span', class_='data-box').next_sibling.next_sibling.get_text() 53 #统一单位 54 if '万' not in pl: 55 pl = '%.1f' % (float(pl) / 10000) 56 # print(123, pl) 57 else: 58 pl = re.search(r'\d*(\.)?\d', pl).group() 59 pls.append(float(pl)) 60 print(pls) 61 # 收藏数 62 for tag in soup.find_all('div', class_='detail'): 63 sc = tag.find('span', class_='data-box').get_text() 64 sc = re.search(r'\d*(\.)?\d', sc).group() 65 scs.append(float(sc)) 66 print(scs) 67 68 69 # 存储至excel表格中 70 info = {'动漫名': name, '播放量(万)': bfl, '评论数(万)': pls, '收藏数(万)': scs} 71 dm_file = pandas.DataFrame(info) 72 #查找重复值 73 print(dm_file.duplicated()) 74 75 #查找缺少值 76 print(dm_file.isnull()) 77 78 dm_file.to_excel('Dongman.xlsx', sheet_name="动漫数据分析") 79 # 将所有列表返回 80 return name, bfl, pls, scs, TScore 81 82 83 def view(info): 84 my_font = font_manager.FontProperties(fname='./data/simhei.ttf') # 设置中文字体(图标中能显示中文) 85 dm_name = info[0] # 番剧名 86 dm_play = info[1] # 番剧播放量 87 dm_review = info[2] # 番剧评论数 88 dm_favorite = info[3] # 番剧收藏数 89 90 # 为了坐标轴上能显示中文 91 plt.rcParams['font.sans-serif'] = ['SimHei'] 92 plt.rcParams['axes.unicode_minus'] = False 93 94 95 # *******收藏数条形图 96 fig, ax1 = plt.subplots() 97 plt.bar(dm_name, dm_favorite, color='red') #设置柱状图 98 plt.title('综合评分和播放量数据分析', fontproperties=my_font) # 表标题 99 ax1.tick_params(labelsize=6) 100 plt.xlabel('番剧名') # 横轴名 101 plt.ylabel('收藏数') # 纵轴名 102 plt.xticks(rotation=90, color='green') # 设置横坐标变量名旋转度数和颜色 103 plt.show() 104 105 106 107 # 评论数条形图 108 fig, ax3 = plt.subplots() 109 plt.bar(dm_name, dm_review, color='green') 110 plt.title('番剧评论数和收藏数分析') 111 plt.ylabel('评论数(万)') 112 ax3.tick_params(labelsize=6) 113 plt.xticks(rotation=90, color='green') 114 plt.show() 115 116 117 # 综合评分条形图 118 fig, ax5 = plt.subplots() 119 plt.bar(dm_name, dm_favorite, color='red') 120 plt.title('综合评分和收藏数量数据分析') 121 plt.ylabel('综合评分') 122 ax5.tick_params(labelsize=6) 123 plt.xticks(rotation=90, color='green') 124 plt.show() 125 126 127 #播放量条形图 128 fig, ax7 = plt.subplots() 129 plt.bar(dm_name, dm_play, color='cyan') 130 plt.title('播放量和评论数 数据分析') 131 plt.ylabel('播放量(万)') 132 ax7.tick_params(labelsize=6) 133 plt.xticks(rotation=90, color='green') 134 plt.show() 135 136 #绘制播放量占比饼图 137 plt.figure(figsize=(7, 7)) 138 # 标签名 139 labels = dm_name[:5] 140 # 构造数据 141 data = dm_play[:5] 142 143 # 绘制图形 144 plt.pie(data, labels=labels, autopct='%1.1f%%') 145 plt.title('播放量占比') 146 plt.savefig('播放量占比.jpg') 147 plt.show() 148 149 # 绘制番剧评论数占比饼图 150 plt.figure(figsize=(7, 7)) 151 labels = dm_name[:5] 152 data = dm_review[:5] 153 154 plt.pie(data, labels=labels, autopct='%1.1f%%') 155 plt.title('番剧评论数占比') 156 plt.savefig('番剧评论数占比.jpg') 157 plt.show() 158 159 # 绘制番剧收藏数占比饼图 160 plt.figure(figsize=(7, 7)) 161 labels = dm_name[:5] 162 data = dm_favorite[:5] 163 164 plt.pie(data, labels=labels, autopct='%1.1f%%') 165 plt.title('番剧收藏数占比') 166 plt.savefig('番剧收藏数占比.jpg') 167 plt.show() 168 169 170 def rc(): 171 # 分析两组数据并画散点图和建立回归方程 172 # 设置中文字体 173 plt.rcParams['font.sans-serif'] = ['SimHei'] 174 175 # 嵌套函数 176 # 需要拟合的函数func,指定函数的形状 177 def func1(p, x): 178 a, b, c = p 179 return a * x * x + b * x + c 180 181 # 偏差函数 182 def error1(p, x, y): 183 return func1(p, x) - y 184 df = pd.DataFrame(pd.read_excel('Dongman.xlsx')) 185 # 画样本图像 186 plt.scatter(df['收藏数(万)'], df['播放量(万)']) 187 188 # 设置样本数据 189 X =df['收藏数(万)'] / 10000 190 Y = df['播放量(万)'] / 10000 191 plt.figure(figsize=(8, 6)) 192 193 # 设置函数拟合参数 194 p0 = [1, 15, 20] 195 196 # 进行最小二乘拟合 197 para = leastsq(error1, p0, args=(X, Y)) 198 a, b, c = para[0] 199 200 # 读取结果 201 print('a=', a, 'b=', b, 'c=', c) 202 print("求解的拟合直线为:") 203 print("y=" + str(round(a, 2)) + "x*x" + str(round(b, 2)) + "x+" + str(round(c, 2))) 204 205 # 画拟合曲线 206 plt.scatter(X, Y, color='green', label='样本数据', linewidth=2) 207 x = np.linspace(1, 15, 20) 208 y = a * x * x + b * x + c 209 plt.plot(x, y, color='red', label='拟合曲线', linewidth=2) 210 plt.legend() 211 plt.title('') 212 plt.grid() 213 plt.show() 214 215 216 def main(): 217 url = 'https://www.bilibili.com/v/popular/rank/bangumi' # 网址 218 html = get_html(url) # 获取返回值 219 # print(html) 220 info = save(html) 221 view(info) 222 rc() 223 224 225 if __name__ == '__main__': 226 main()(三)、总结与反思 1.总结 (1)流行动漫中大部分以日漫为主,国漫极少; (2)多为异世界,玄幻为题材,纪实较少; (3)评论量与收藏量数据差异很大,导致无法做出合适的拟合分析; 2.课题总结与反思 通过此次课程设计,使我更加扎实的掌握了python爬虫方面的知识,在设计过程中虽然遇到了ー些问题,但经过一次又ー次的思考,一遍又一遍的检查终于找出了原因所在,也暴露出了前期我在这方面的知识欠缺和经验不足。实践出真知,通过亲自动手制作,使我们掌握的知识不再是纸上谈兵,我会继续加油! |


【本文地址】
今日新闻 |
推荐新闻 |