最全的R语言聚类树形图画法 |
您所在的位置:网站首页 › 原因树状图怎么绘制 › 最全的R语言聚类树形图画法 |
最全的R语言聚类树形图画法
|
因为在写论文的时候用到,所以和大家分享。原地址为 http://rstudio-pubs-static.s3.amazonaws.com/1876_df0bf890dd54461f98719b461d987c3d.html 考虑到原地址可能失效,这里做简单的翻译和备份,有关聚类的R包可以参考cluster包和ape包
以下是正文: The most basic dendrogram Let's start with the most basic type of dendrogram. For that purpose we'll use themtcars dataset and we'll calculate a hierarchical clustering with the functionhclust (with the default options). 让我们从最基本聚类树状图开始。为此目的,我们将使用mtcars数据集和我们计算的层次聚类hclust函数(与默认选项)。 # prepare hierarchical cluster 生成层次聚类 hc = hclust(dist(mtcars)) # very simple dendrogram 默认画法 plot(hc)
We can put the labels of the leafs at the same level like this 我们可以将样本定义在同一水平 (实在不明白help一下plot函数) In order to add more format to the dendrograms, we need to tweek the right parameters. For instance, we could get the following graphic (just for illustration purposes!) 一个更基本的树状图 为了增加更多格式的图,我们需要修改正确的参数。例如,我们可以得到下面的图形(仅作说明用途!) 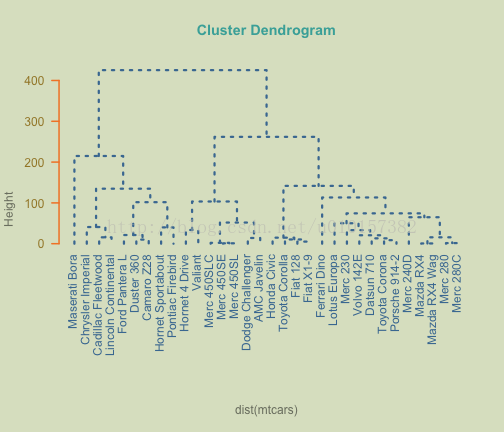
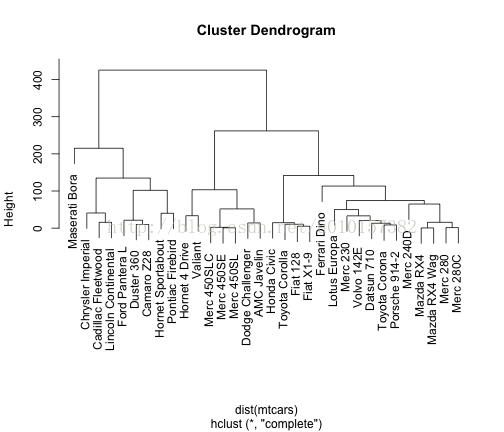
par(op) ##这里强调一下,par()是对图进行自动调整,貌似功能还挺强大的。新浪有位哥们儿总结得特别好,附赠地址: http://blog.sina.com.cn/s/blog_8f5b2a2e0102v0tf.html 貌似可以靠par()函数调整图的坐标轴什么的,我没试过哦~~ Alternative dendrograms An alternative way to produce dendrograms is to specifically convert hclust objects into dendrograms objects另类聚类图 将hclude生成的对象转换为另类的聚类图 # using dendrogram objects hcd = as.dendrogram(hc) # alternative way to get a dendrogram plot(hcd) 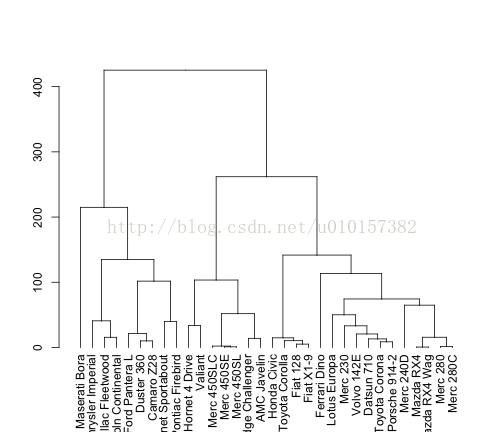
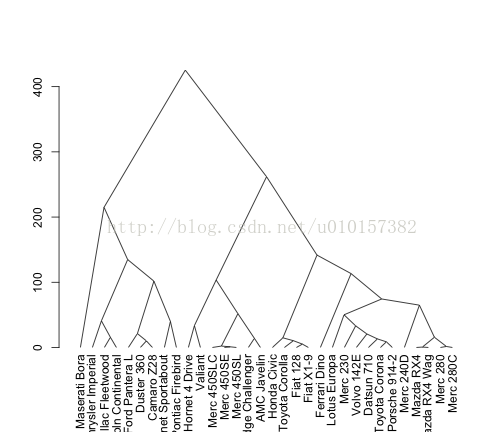
Having an object of class dendrogram, we can also plot the branches in a triangular form 画完这个画三角形的 Zooming-in on dendrograms Another very useful option is the ability to inspect selected parts of a given tree. For instance, if we wanted to examine the top partitions of the dendrogram, we could cut it at a height of 75 放大在树状图 另一个非常有用的功能是选择树的一部分。例如,如果我们要研究的树状图上的分区,我们可以把它在一个高度75 # plot dendrogram with some cuts op = par(mfrow = c(2, 1)) plot(cut(hcd, h = 75)$upper, main = "Upper tree of cut at h=75") plot(cut(hcd, h = 75)$lower[[2]], main = "Second branch of lower tree with cut at h=75")par(op) Customized dendrogramsIn order to get more customized graphics we need a little bit of more code. A very useful resource is the functiondendrapply that can be used to apply a function to all nodes of a dendrgoram. This comes very handy if we want to add some color to the labels. 为了获得更多的定制的图形,我们需要更多的代码。一个非常有用的功能dendrapply可以应用一个函数的一dendrgoram所有节点。如果我们要添加一些色彩的标签这是非常方便的。 # vector of colors labelColors = c('red', 'blue', 'darkgreen', 'darkgrey', # 'purple') labelColors = c("#CDB380", "#036564", "#EB6841", "#EDC951") # cut dendrogram in 4 clusters clusMember = cutree(hc, 4) # function to get color labels colLab |


【本文地址】