用Python抓新型冠状病毒肺炎实时数据,绘制省级疫情分布图 |
您所在的位置:网站首页 › 全国新型肺炎分布图 › 用Python抓新型冠状病毒肺炎实时数据,绘制省级疫情分布图 |
用Python抓新型冠状病毒肺炎实时数据,绘制省级疫情分布图
|
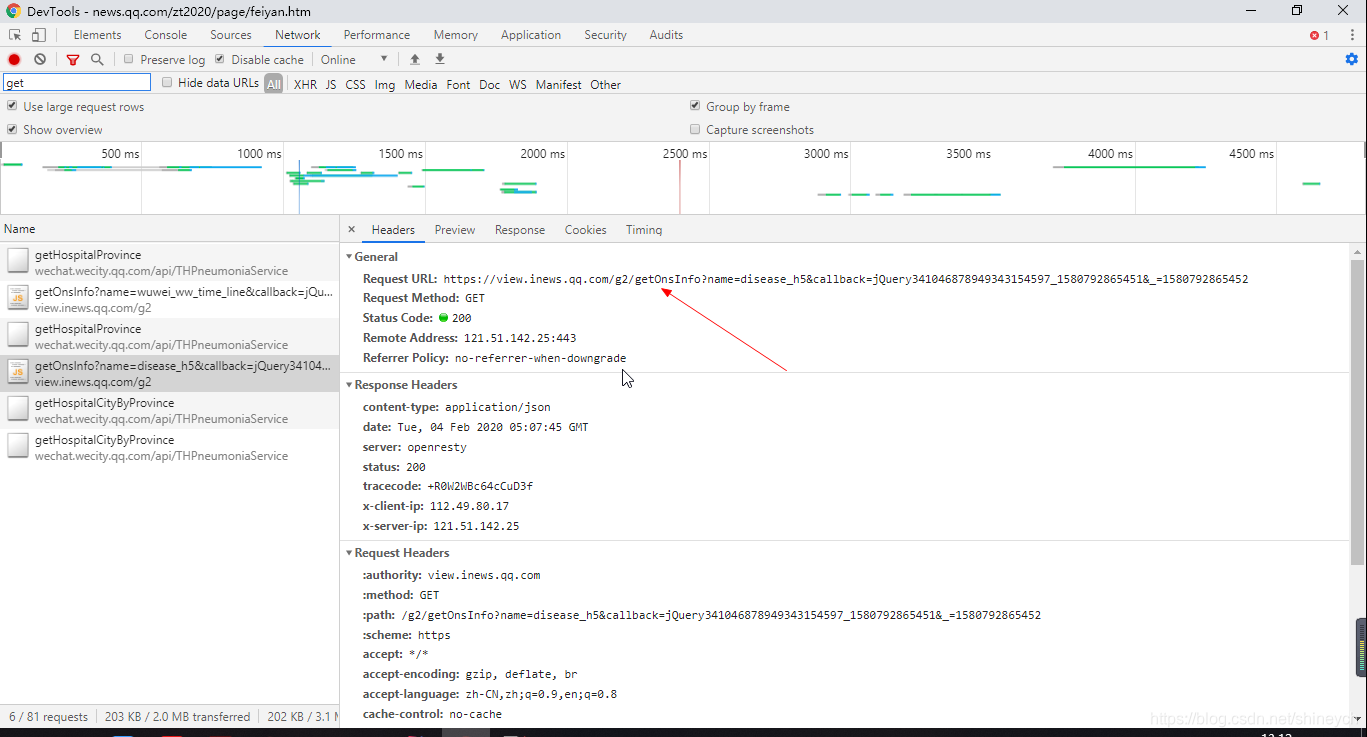
说明: 本文是Python可视化技术结合时下热点进行进行开发、讲解的案例,也是计算机编程课程思政的一个形式。文章遵守CSDN平台规定和国家法规(非新闻资质的网站不允许发布疫情数据),对运行结果图片中的数据(2020年2月4日)打马赛克屏蔽,同时删除提供数据的网站链接以及报文中的数值信息。 文章目录 运行结果(2020-2-4日数据,福建省)数据爬取抓包分析数据格式地理数据 代码实现其他 运行结果(2020-2-4日数据,福建省)
数据来源于腾讯实时疫情动态
具体数值用星号替代 ''' "chinaTotal": { "confirm": ***, "suspect": ***, "dead": ***, "heal": *** }, "chinaAdd": { "confirm": ***, "suspect": ***, "dead": ***, "heal": *** }, "lastUpdateTime": "2020-02-04 12:43:19", "areaTree": [{ "name": "中国", "children": [{ "name": "湖北", "children": [{ "name": "武汉", "total": { "confirm": ***, "suspect": ***, "dead": ***, "heal": *** }, "today": { "confirm": ***, "suspect": ***, "dead": ***, "heal": *** } }, { "name": "黄冈", "total": { "confirm": ***, "suspect": ***, "dead": ***, "heal": *** }, "today": { "confirm": ***, "suspect": ***, "dead": ***, "heal": *** } }, { 。。。。。。 ''' 地理数据gadm地图数据(gadm36_CHN_shp.zip)请自行下载,这个数据包括国家、省、市三级行政区域,但是市级数据不准确 代码实现 #%% import time, json, requests from datetime import datetime import matplotlib import matplotlib.pyplot as plt import matplotlib.dates as mdates from matplotlib.font_manager import FontProperties from mpl_toolkits.basemap import Basemap from matplotlib.patches import Polygon import jsonpath import numpy as np plt.rcParams['font.sans-serif'] = ['SimHei'] # 用来正常显示中文标签 plt.rcParams['axes.unicode_minus'] = False # 用来正常显示负号 #%% # 获取全国疫情报告,来源于腾讯 def catch_world_disease_report(): timestamp = '%d'%int(time.time()*1000) url_area = ('https://view.inews.qq.com/g2/getOnsInfo?name=disease_h5' '&callback=&_=') + timestamp # 不处理异常了 data_json = json.loads(requests.get(url=url_area).json()['data']) return data_json world_data = catch_world_disease_report() # print(area_data) #%% # 福建疫情地区分布(确诊病例) # get请求,腾讯返回json,如下: def catch_fj_disease_distribution(): # world_data = catch_world_disease_report() dic_fj_confirm = dict() # 解析福建各个城市的数据 dic_fj = jsonpath.jsonpath(world_data, expr='$.areaTree[0].children[?(@.name=="福建")].children[*]') for item in dic_fj: if item['name'] not in dic_fj_confirm: dic_fj_confirm.update({item['name']:0}) dic_fj_confirm[item['name']] += int(item['total']['confirm']) return dic_fj_confirm area_data = catch_fj_disease_distribution() print(area_data) #%% # 绘制福建省确诊分布图 def plot_fj_area_distribution(): area_cfm_data = catch_fj_disease_distribution() # 标签颜色和文本 legend_handles = [ matplotlib.patches.Patch(color='#7FFFAA', alpha=1, linewidth=0), matplotlib.patches.Patch(color='#ffaa85', alpha=1, linewidth=0), matplotlib.patches.Patch(color='#ff7b69', alpha=1, linewidth=0), matplotlib.patches.Patch(color='#bf2121', alpha=1, linewidth=0), matplotlib.patches.Patch(color='#7f1818', alpha=1, linewidth=0), ] legend_labels = ['0人', '1-10人', '10-30人', '30-50人', '>50人'] fig = plt.figure(facecolor='#f4f4f4', figsize=(10, 8)) axes = fig.add_axes((0.1, 0.1, 0.8, 0.8)) axes.set_title('福建省新型冠状病毒疫情地图', fontsize=20) axes.legend(legend_handles, legend_labels, bbox_to_anchor=(0.5, -0.11), loc='lower center', ncol=5) # 横轴墨卡托投影 china_map = Basemap(llcrnrlon = 115.8, llcrnrlat = 23.3, urcrnrlon = 120.6, urcrnrlat = 28.4, resolution = 'i', projection = 'tmerc', lat_0 = 26, lon_0 = 119, ax=axes) # gadm36_CHN_1 省一级;gadm36_CHN_2 市一级;gadm36_CHN_1 县一级 ''' {'GID_0': 'CHN', 'NAME_0': 'China', 'GID_1': 'CHN.4_1', 'NAME_1': 'Fujian', 'NL_NAME_1': '福建', 'GID_2': 'CHN.4.1_1', 'NAME_2': 'Fuzhou', 'VARNAME_2': 'Fúzhōu', 'NL_NAME_2': '福州市', 'TYPE_2': 'Dìjíshì', 'ENGTYPE_2': 'Prefecture City', 'CC_2': '', 'HASC_2': '', 'RINGNUM': 1, 'SHAPENUM': 20} ''' china_map.readshapefile('res/gadm36_CHN_shp/gadm36_CHN_2', 'states', drawbounds=True) china_map.drawmapboundary(fill_color='aqua') china_map.fillcontinents(color='white', lake_color='aqua') china_map.drawcoastlines() for info, shape in zip(china_map.states_info, china_map.states): prov_name = info['NAME_1'].strip() if prov_name != 'Fujian': continue is_reported = False # 若龙岩没有疫情,数据源就取不到其数据,而非显示0 city_name = info['NL_NAME_2'].strip() city_name = city_name.rstrip('市') if city_name in area_cfm_data.keys(): is_reported = True # print('city: ', city_name, ' count:', fujian_data[city_name]) if area_cfm_data[city_name] == 0: color = '#f0f0f0' elif area_cfm_data[city_name] |


【本文地址】
今日新闻 |
推荐新闻 |