Python小工具(3) |
您所在的位置:网站首页 › 作图工具包 › Python小工具(3) |
Python小工具(3)
|
Python数据分析:图表美观清晰,自带对比功能
安装使用示例
本文转自Github
点此进入传送门
来自于哈佛天文研究所博士后自己制作的小工具,主要是在matplotlib上增加的一些小功能,支持调用不同期刊要求的格式进行作图 图示及翻译部分引用 量子位公众号推送文章 安装pip就行(在Matplotlib基础上) # for latest commit pip install git+https://github.com/garrettj403/SciencePlots.git # for lastest release pip install SciencePlotsThe pip installation will automatically move all of the *.mplstyle files into the appropriate directory. If you like, you can also do this manually. First, clone the repository and then copy all of the *.mplstyle files into your Matplotlib style directory. If you’re not sure where this is, in an interactive python console type: # 手动安装 获得具体路径 import matplotlib print(matplotlib.get_configdir())编译器会返回Matplotlib的路径,你可能还需要手动建立一个stylelib文件夹。 使用science.mplstyle 是这个补充包最基本的一种风格,基本满足一般科研论文的绘图要求,代码如下: import matplotlib.pyplot as plt plt.style.use('science') plt.style.use(['science','ieee']) #the ieee style will override some of the parameters from the science style in order to configure the plot for IEEE papers (column width, fontsizes, etc.). with plt.style.context(['science', 'ieee']): plt.figure() plt.plot(x, y) plt.show() 示例science 风格
检查更新版本 pip install SciencePlots |
 science+grid(网格)风格:
  ieee风格:IEEE期刊对图表的尺寸、文字大小都有要求,同时还要求在黑白印刷时也能清晰呈现,下图是符合要求的science+ieee风格:
  science+scatter(离散)风格:
  Jupyter环境下的notebook风格:
 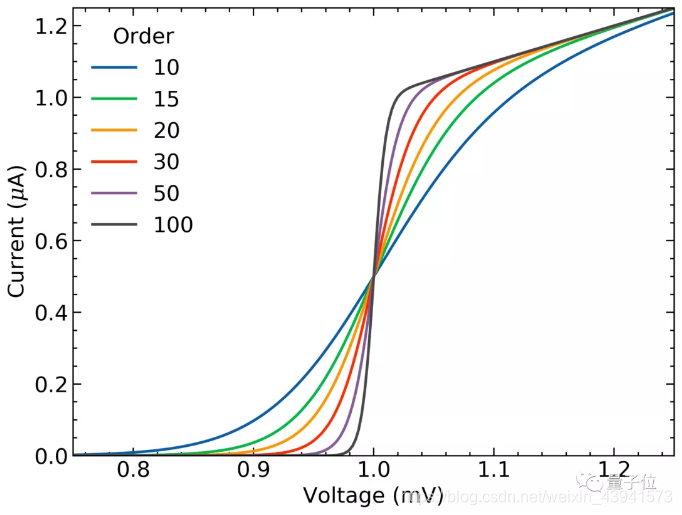 补充包中的风格也可以和Matplotlib中的已有风格一起调用,例如dark_background + science + high-vis:
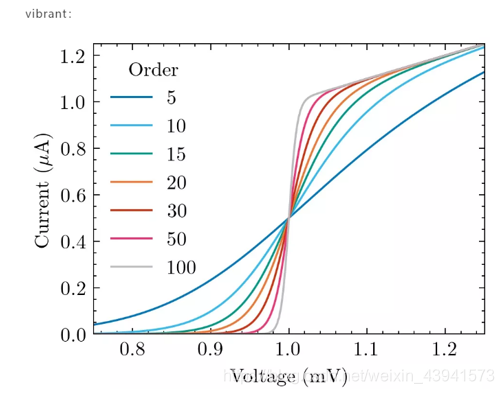
 此外,扩展包还提供多种绘图==色彩搭配方案==


 补充包默认使用Latex字体渲染,如果电脑中没有Latex,可以改用无Latex渲染模式:
【本文地址】