RGB图像,索引图像,灰度图像,二值图像相互转换 |
您所在的位置:网站首页 › 二值图像函数 › RGB图像,索引图像,灰度图像,二值图像相互转换 |
RGB图像,索引图像,灰度图像,二值图像相互转换
|
%小白从零开始学习图像处理,自己看的不知道理解的是不是正确,在慢慢进步 1.将RGB图像转换为灰度图像 close all clear all clc RGB=imread(‘haixiquan.jpg’); %读取RGB图像 gray=rgb2gray(RGB); %将RGB图像转换为灰度图像 figure; set(0,‘defaultFigurePosition’,[100,100,1000,500]);%设置显示图像的窗口大小 set(0,‘defaultFigureColor’,[1 0 0]);%设置显示的背景颜色 subplot(121),imshow(RGB),title(‘RGB图像’); %subplot是图像分割函数,imshow是显示图像函数,title是在图像上面加标题 subplot(122),imshow(gray),title(‘灰度图’); 2.彩色索引表换位灰色索引表 close all clear all clc RGB=imread(‘haixiquan.jpg’); %提取RGB图像 [X,map]=rgb2ind(RGB,0.2); %将RGB图像转变为索引图像,获得map表 newmap=rgb2gray(map); %将彩色的索引表换为灰色索引表 figure; set(0,‘defaultFigureColor’,[0 0 0]); subplot(131),imshow(X,map); subplot(132),imshow(X,newmap); subplot(133),imshow(RGB); 3.RGB图像转换为索引图像 close all clear all clc RGB=imread(‘haixiquan.jpg’); [X1,map1]=rgb2ind(RGB,64); [X2,map2]=rgb2ind(RGB,0.2); map3=colorcube(128); X3=rgb2ind(RGB,map3); figure; set(0,‘defaultFigurePosition’,[100,100,500,500]); set(0,‘defaultFigurecolor’,[0 0 0]); subplot(221),imshow(X1,map1),title(‘最小方差’); subplot(222),imshow(X2,map2),title(‘均匀方差量化’); subplot(223),imshow(X3,map3),title(‘颜色近似法转换’); subplot(224),imshow(RGB),title(‘原图’); |
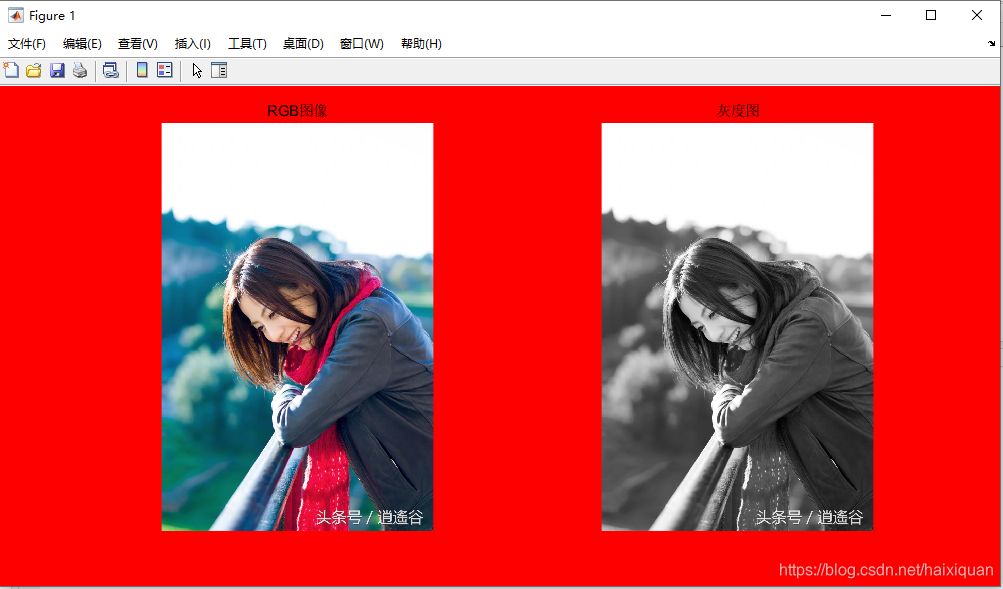 首先对各个函数理解一下 1.imread() 就是调入图像 2.rgb2gray() 就是RGB转换为灰度的函数 3.set(0,‘defaultFigurePosition’,[100,100,1000,500]); 设置显示图像的窗口位置大小,100,100 是图形显示在窗口的位置坐标,换一下大小就可以看出来,1000,500是显示figure的大小 4.title 就是图片上标题 5.set(0,‘defaultFigureColor’,[1 0 0]); 设置显示的背景颜色,[0 0 0]显示黑色背景,[1 0 0]显示背景是红色
 所用一些函数的解释 这里解释一下 [X,map]=rgb2ind(RGB,0.2) %RGB转换为索引图像时有常用三种不同的转换方法,最小方差转换、均匀量化转换和颜色近似法转换。
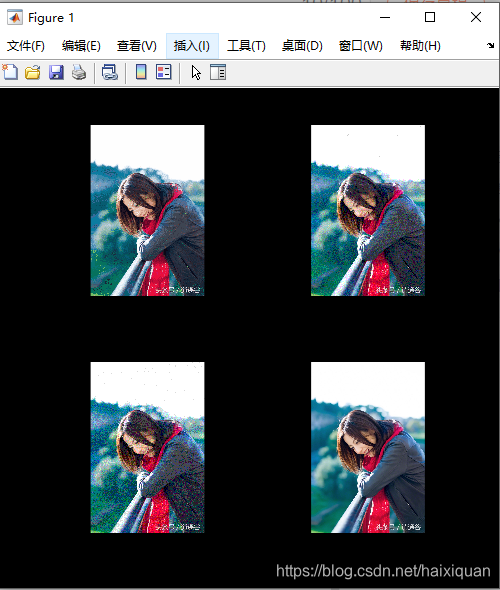 解释一下这个图像转换中遇到的问题 [X1,map1]=rgb2ind(RGB,64) %就是使用最小方差量化将RGB图像转换为索引图像X. MAP最多包含N种颜色。 N必须
【本文地址】