|
背景
echarts3之后map需要自己填坐标数据,可参考echarts.apache.org/zh/option.h…
地图数据可使用高德数据
datav.aliyun.com/tools/atlas…
展示效果
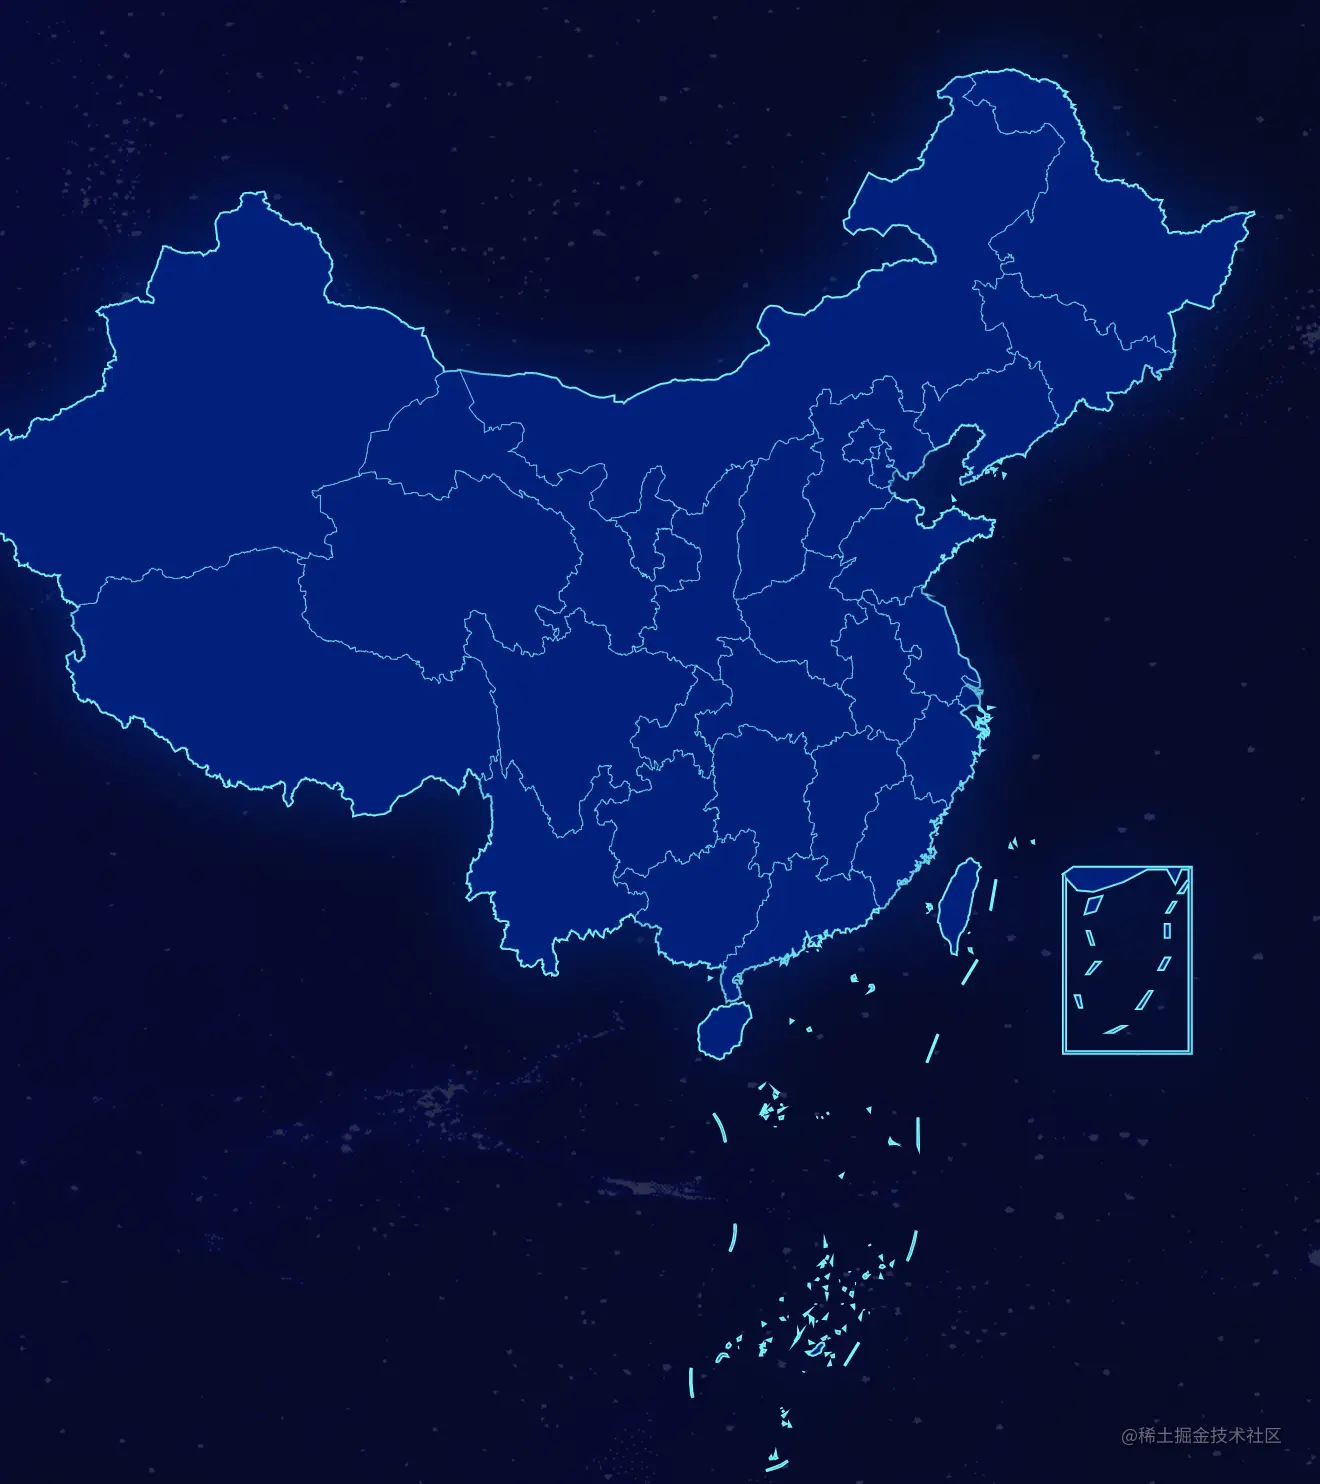
问题
南海诸岛缩略图显示不全,图一,图二两部分二选即可。


解决方案
方案一
显示九段图,隐藏缩略图
china.json:datav.aliyun.com/tools/atlas…
regions: [
{
name: "南海诸岛",
itemStyle: {
// 隐藏地图
normal: {
opacity: 0, // 为 0 时不绘制该图形
},
},
label: {
show: false, // 隐藏文字
},
},
],
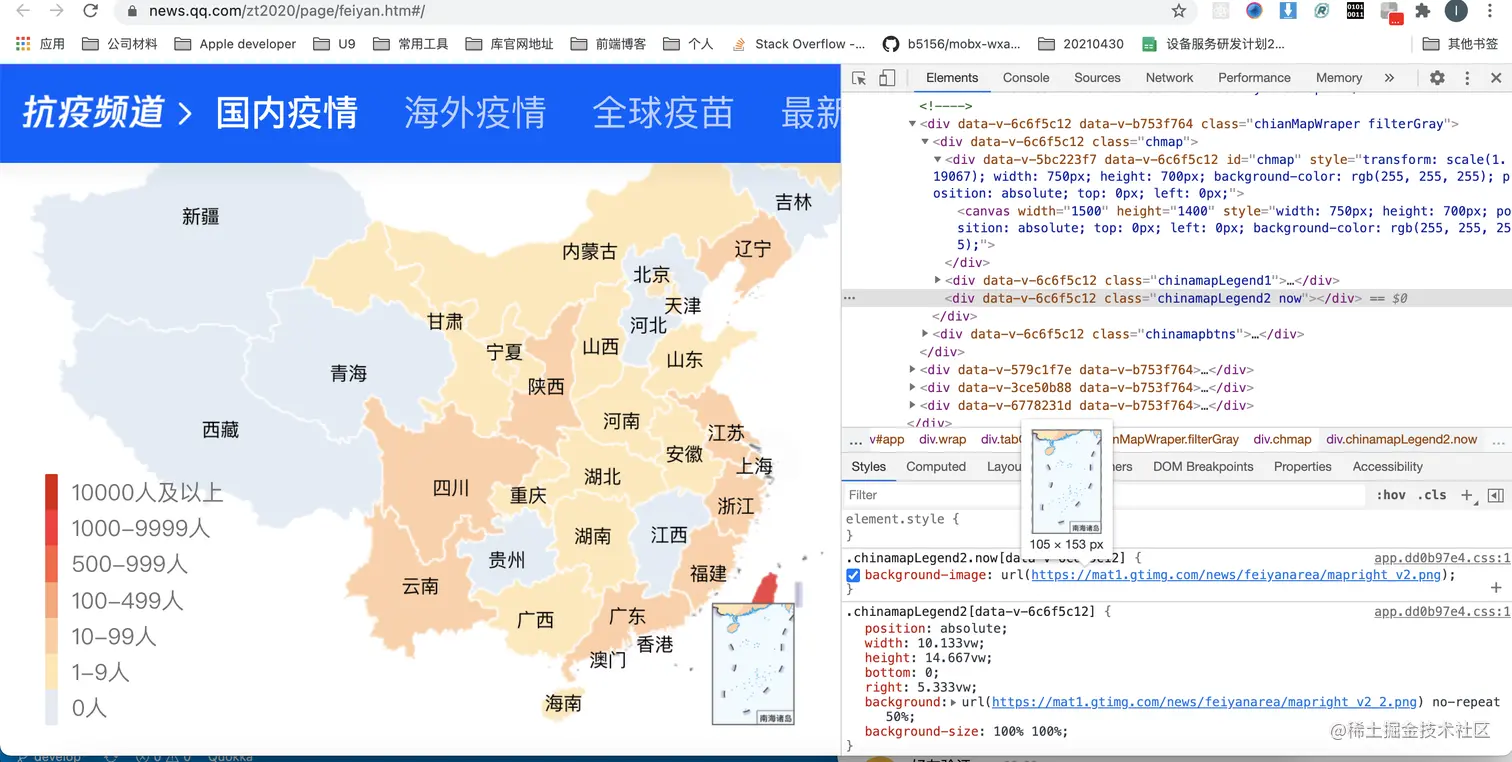
方案二
南海缩略图使用图片代替,腾讯健康、阿里统计目前是用图片来展示的
china.json:gallerybox.makeapie.com/asset/get/s…
可参考

/**
* App模块
*/
import React, { Component } from "react";
import * as echarts from "echarts";
import china from "./china.json";
import { actions } from "mirrorx";
import "./index.less";
var convertData = function (data) {
var res = [];
for (var i = 0; i < data.length; i++) {
res.push({
name: data[i].county,
value: [data[i].log, data[i].lot, data[i].eqCount],
});
}
return res;
};
class Map extends Component {
constructor(props) {
super(props);
this.ref = React.createRef();
this.state = {
myChart: null,
option: {
title: {
x: "center",
textStyle: {
color: "#fff",
},
},
tooltip: {
trigger: "item",
formatter: function (params) {
return `${params.name} : ${params.value[2]} (${params.seriesName}) `;
},
},
legend: {
orient: "vertical",
bottom: "3%",
x: "10%",
data: [],
itemWidth: 10,
itemHeight: 10,
textStyle: {
color: "#fff",
fontSize: 12,
},
},
geo: [
{
zlevel: 2,
map: "china",
left: 30,
right: 30,
top: "5%",
regions: [
{
name: "南海诸岛",
itemStyle: {
// 隐藏地图
normal: {
opacity: 0, // 为 0 时不绘制该图形
},
},
label: {
show: false, // 隐藏文字
},
},
],
label: {
normal: {
textStyle: {
fontSize: 12,
color: "#fff",
},
},
emphasis: {
textStyle: {
fontSize: 12,
color: "#fff",
},
},
},
itemStyle: {
normal: {
areaColor: "#001D81",
borderColor: "#2efbfd",
borderWidth: 0.3,
},
emphasis: {
areaColor: "#0a54ea",
},
},
},
{
map: "china",
left: 30,
right: 30,
top: "5%",
regions: [
{
name: "南海诸岛",
itemStyle: {
// 隐藏地图
normal: {
opacity: 0, // 为 0 时不绘制该图形
},
},
label: {
show: false, // 隐藏文字
},
},
],
itemStyle: {
normal: {
borderColor: "#2efbfd",
borderWidth: 1.6,
shadowColor: "#00207e",
shadowBlur: 40,
},
},
},
],
series: [],
},
};
}
async componentDidMount() {
this.myChart = echarts.init(this.ref.current);
echarts.registerMap("china", china);
this.draw();
let data = await actions.home.getMapData();
this.setData(data);
}
setData(result) {
if (result.result && result.result.data) {
let arr = [];
let data = result.result.data;
let newOption = { ...this.state.option };
newOption.legend.data = [];
newOption.series = [];
let obj = {};
let color = ["#FFDD00", "#EB6D19", "#27B9F6", "#2CAE45", "#334553"];
for (let i in data) {
arr.push({
name: i,
data: data[i],
});
}
// arr = arr.sort((a, b) => b.data.length - a.data.length).splice(0, 5);
arr.forEach((item, index) => {
newOption.legend.data.push(item.name);
let obj = {
zlevel: 3,
name: item.name,
type: "scatter",
coordinateSystem: "geo",
data: convertData(item.data),
color: color[index],
symbolSize: 6,
itemStyle: {
normal: {
shadowColor: color[index],
shadowBlur: 5,
},
emphasis: {
borderColor: "#fff",
borderWidth: 1,
},
},
};
newOption.series.push(obj);
});
this.setState({
option: newOption,
});
this.draw();
}
}
draw() {
this.myChart.setOption(this.state.option);
}
render() {
return ;
}
}
Map.displayName = "Map";
export default Map;
参考文章:blog.csdn.net/weixin_4251…
|