|
echarts组件使用参考:https://blog.csdn.net/weixin_50450473/article/details/121510438
目录
图例一
图例二
图例三
图例四
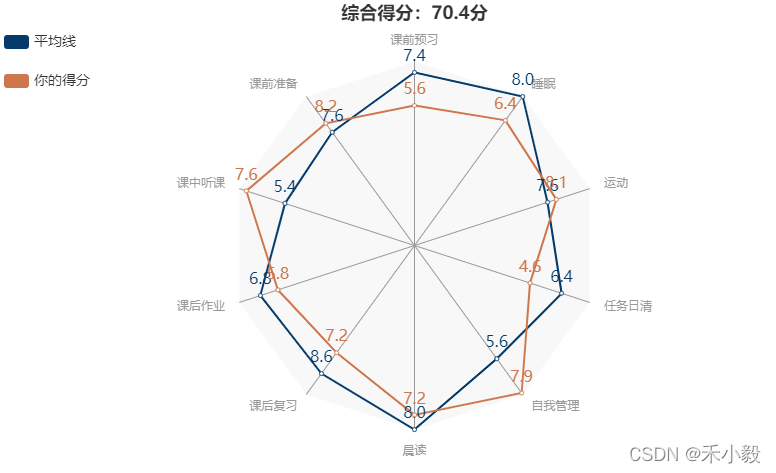
图例一:
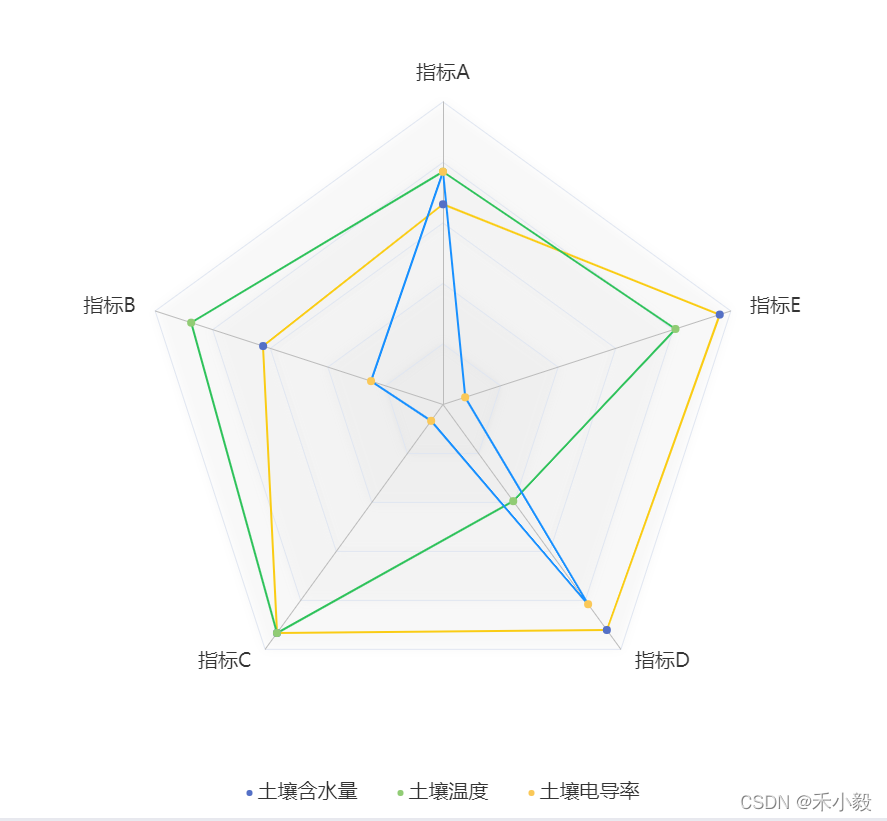
图例二:
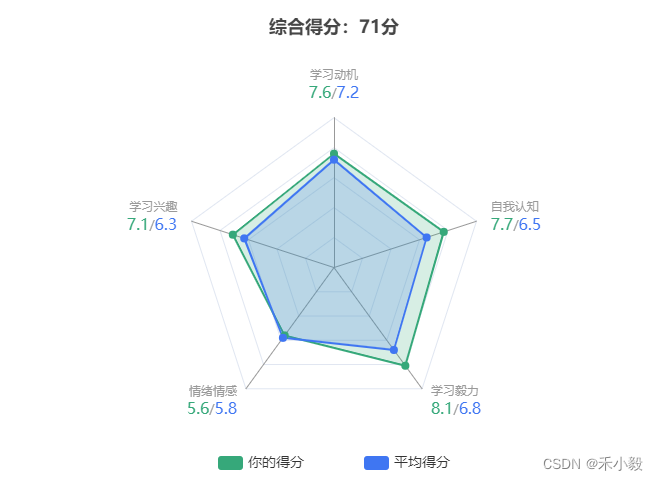
图例三:
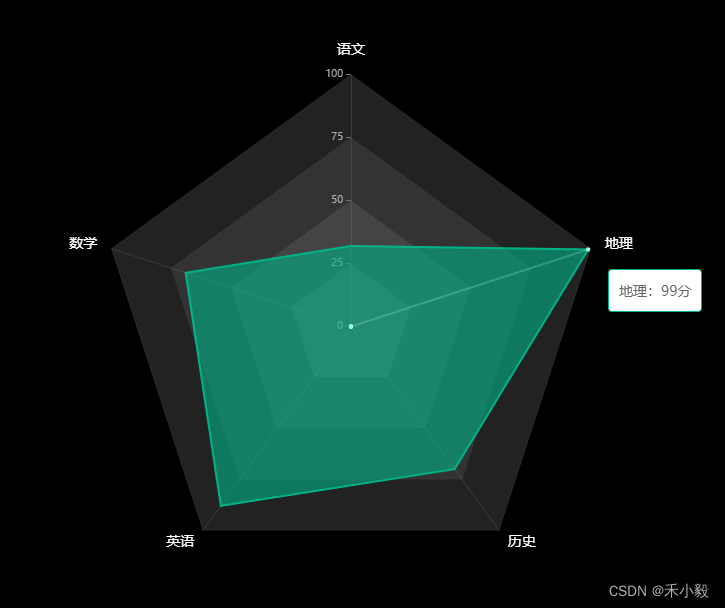
图例四:单个项目动画轮播tooltip
图例一
let datas = {
textName: [{ text: '平均线' }, { text: '你的得分' }],
content: [
{ uValue: 8.2, avgValue: 7.6, name: '课前准备' },
{ uValue: 5.6, avgValue: 7.4, name: '课前预习' },
{ uValue: 6.4, avgValue: 8.0, name: '睡眠' },
{ uValue: 8.1, avgValue: 7.6, name: '运动' },
{ uValue: 4.6, avgValue: 6.4, name: '任务日清' },
{ uValue: 7.9, avgValue: 5.6, name: '自我管理' },
{ uValue: 8.0, avgValue: 7.2, name: '晨读' },
{ uValue: 6.8, avgValue: 5.8, name: '课后作业' },
{ uValue: 7.2, avgValue: 8.6, name: '课后复习' },
{ uValue: 7.6, avgValue: 5.4, name: '课中听课' }
]
};
let textList = []; // 线条类型
let nameList = []; // 选项标题
let aveList = []; // 平均线
let uList = []; // 你的得分
let avgNum = 0; // 综合得分
let txt = '';
datas.textName.forEach((t) => { txt += t.text + ','; });
textList = txt.substring(0, txt.length - 1).split(',');
// 数据
let names = '';
let avg = '';
let u = '';
let sum = 0;
datas.content.forEach((c) => {
names += c.name + ',';
avg += c.avgValue + ',';
u += c.uValue + ',';
sum += c.uValue;
});
avgNum = sum.toFixed(1);
aveList = avg.substring(0, avg.length - 1).split(',');
uList = u.substring(0, u.length - 1).split(',');
names.substring(0, names.length - 1).split(',').forEach((n) => {
nameList.push({ name: n });
});
option = {
title: {
text: '综合得分:' + avgNum + '分',
left: 'center'
},
legend: {
orient: 'vertical',
data: textList,
left: 'left',
top: '30px',
itemGap: 25,
textStyle: {
// 图例文字的样式
fontSize: 14
}
},
radar: {
// 设置雷达图中间射线的颜色
axisLine: {
lineStyle: {
color: '#999',
fontSize: 30
}
},
splitLine: {
show: false
},
indicator: nameList,
// 雷达图背景的颜色,在这儿随便设置了一个颜色,完全不透明度为0,就实现了透明背景
splitArea: {
areaStyle: {
color: '#f8f8f8' // 图表背景的颜色
}
}
},
series: [
{
type: 'radar',
data: [
{
value: aveList,
name: '平均线',
// 设置区域边框和区域的颜色
itemStyle: {
color: '#043B6B'
},
label: {
show: true,
fontSize: 16,
formatter: function (params) {
return params.value;
}
}
},
{
value: uList,
name: '你的得分',
// 设置区域边框和区域的颜色
itemStyle: {
color: '#ce764c'
},
label: {
show: true,
fontSize: 16,
formatter: function (params) {
return params.value;
}
}
}
]
}
]
};
图例二
option = {
tooltip: {},
legend: {
show: true,
data: [
{ name: '土壤含水量', icon: 'circle' },
{ name: '土壤温度', icon: 'circle' },
{ name: '土壤电导率', icon: 'circle' }
],
itemWidth: 6,
itemGap: 40,
bottom: 0,
textStyle: {
color: '#333',
fontSize: 20
}
},
radar: {
name: {
textStyle: {
color: '#333',
fontSize: 20,
borderRadius: 3,
padding: [3, 5]
}
},
indicator: [
{ name: '指标A', max: 6500 },
{ name: '指标B', max: 16000 },
{ name: '指标C', max: 30000 },
{ name: '指标D', max: 38000 },
{ name: '指标E', max: 52000 }
],
splitArea: {
areaStyle: {
color: [
'rgba(255,255,255, 0.5)',
'rgba(255,255,255, 0.3)',
'rgba(255,255,255, 0.2)',
'rgba(255,255,255, 0.2)',
'rgba(255,255,255, 0.1)'
],
shadowColor: 'rgba(0, 0, 0, 0.3)',
shadowBlur: 10
}
}
},
series: [
{
name: '预算 vs 开销(Budget vs spending)',
type: 'radar',
data: [
{
value: [4300, 10000, 28000, 35000, 50000],
name: '土壤含水量',
lineStyle: {
color: '#FACC14'
}
},
{
value: [5000, 14000, 28000, 15000, 42000],
name: '土壤温度',
lineStyle: {
color: '#2FC25B'
}
},
{
value: [5000, 4000, 2000, 31000, 4000],
name: '土壤电导率',
lineStyle: {
color: '#1890FF'
}
}
]
}
]
};
图例三
let datas = [
{ Name: '学习动机', TotalScore: 10, Score: 7.6, AvgScore: 7.2 },
{ Name: '学习兴趣', TotalScore: 10, Score: 7.1, AvgScore: 6.3 },
{ Name: '情绪情感', TotalScore: 10, Score: 5.6, AvgScore: 5.8 },
{ Name: '学习毅力', TotalScore: 10, Score: 8.1, AvgScore: 6.8 },
{ Name: '自我认知', TotalScore: 10, Score: 7.7, AvgScore: 6.5 }
];
let colorList = ['#36A87A', '#3f76f2'];
let aveList = datas.map((n) => { return n.AvgScore; });
let uList = datas.map((n) => { return n.Score; });
let nameList = [];
datas.forEach((item) => {
nameList.push({
name: item.Name,
max: 10,
AvgScore: item.AvgScore,
Score: item.Score
});
});
option = {
title: {
text: '综合得分:71分',
left: 'center'
},
legend: {
data: ['你的得分', '平均得分'],
left: 'center',
top: 'bottom',
itemGap: 60,
textStyle: {
// 图例文字的样式
fontSize: 14
}
},
radar: {
center: ['50%', '55%'], // 图表位置
radius: '65%', // 图表大小
// 设置雷达图中间射线的颜色
axisLine: {
lineStyle: {
color: '#999',
fontSize: 30
}
},
indicator: nameList,
// 雷达图背景的颜色,在这儿随便设置了一个颜色,完全不透明度为0,就实现了透明背景
splitArea: {
areaStyle: {
color: '#fff' // 图表背景的颜色
}
},
name: {
lineHeight: 18,
formatter: (labelName, raw) => {
const { AvgScore, Score } = raw;
return (
labelName + '\n' + `{score|${Score}}` + '/' + `{avg|${AvgScore}}`
);
},
rich: {
score: {
color: colorList[0],
fontSize: 16
},
avg: {
color: colorList[1],
fontSize: 16
}
}
}
},
series: [
{
type: 'radar',
data: [
{
value: uList,
name: '你的得分',
// 设置区域边框和区域的颜色
itemStyle: {
color: colorList[0]
},
label: {
show: false,
fontSize: 16,
position: 'right',
color: colorList[0],
formatter: function (params) {
return params.value;
}
},
areaStyle: {
color: colorList[0],
opacity: 0.2
}
},
{
value: aveList,
name: '平均得分',
// 设置区域边框和区域的颜色
itemStyle: {
color: colorList[1]
},
label: {
show: false,
fontSize: 16,
position: 'left',
color: colorList[1],
formatter: function (params) {
return params.value;
}
},
areaStyle: {
color: colorList[1],
opacity: 0.2
}
}
]
}
]
};
图例四
let datas = [
{ name: '语文', value: 32 },
{ name: '数学', value: 69 },
{ name: '英语', value: 88 },
{ name: '历史', value: 70 },
{ name: '地理', value: 99 }
];
let yData = []; // y轴数据
let xName = []; // x轴名称
let max = 100; // 最大数值
let colorList = ['#00B386', '#3f76f2'];
yData = datas.map((n) => {
return n.value;
});
datas.forEach((item) => {
xName.push({ name: item.name, max: max, value: item.value });
});
// 实现单个提示框方法
const buildSeries = function (data) {
const helper = data.map((item, index) => {
const arr = new Array(data.length);
arr.splice(index, 1, item);
return arr;
});
return [data, ...helper].map((item, index) => {
return {
type: 'radar',
symbol: 'circle',
symbolSize: 4, // 原点大小
lineStyle: {
color: index === 0 ? colorList[0] : 'transparent'
},
areaStyle: {
color: colorList[0],
opacity: 0.6,
emphasis: {
color: colorList[0],
opacity: 0.6
}
},
tooltip: {
show: index === 0 ? false : true,
trigger: 'item',
formatter: function () {
return xName[index - 1].name + ':' + yData[index - 1] + '分';
}
},
z: index === 0 ? 1 : 2,
// 设置区域边框和区域的颜色
itemStyle: {
normal: {
// 点的样式
color: colorList[0],
opacity: 0
},
// 鼠标经过的
emphasis: {
show: index === 0 ? false : true,
// 某个点的样式
color: index === 0 ? '' : '#a3ffe7',
opacity: index === 0 ? 0 : 1,
// 中心点连接点的线条
lineStyle: {
color: index === 0 ? colorList[0] : '#a3ffe7',
opacity: index === 0 ? 1 : 0.2
}
}
},
data: [
{
value: item,
label: {
show: false,
fontSize: 16,
position: 'right',
color: colorList[0],
formatter: function (params) {
return params.value;
}
}
}
]
};
});
};
option = {
backgroundColor: '#000',
tooltip: {},
radar: {
splitNumber: 4, // 中间辅助线
center: ['50%', '50%'], // 图表位置
radius: '65%', // 图表大小
// 设置雷达图中间射线的颜色
axisLine: {
lineStyle: {
color: 'rgba(242, 242, 242, .1)',
fontSize: 40
}
},
// 网格线
splitLine: {
lineStyle: {
color: 'rgba(242, 242, 242, .08)'
}
},
indicator: xName,
// 雷达图背景的颜色,在这儿随便设置了一个颜色,完全不透明度为0,就实现了透明背景
splitArea: {
areaStyle: {
// 图表背景的颜色
color: ['#555555', '#444444', '#333333', '#222222'],
shadowColor: 'rgba(0,0,0,.15)',
shadowBlur: 2
}
},
name: {
lineHeight: 18,
color: '#fff',
fontSize: 14,
formatter: (labelName) => {
return labelName;
}
}
},
// 标轴值
polar: {
radius: '65%'
},
angleAxis: {
zlevel: 0,
min: 0,
max: 360,
clockwise: false,
axisTick: {
show: false
},
axisLabel: {
show: false
},
axisLine: {
show: false
},
splitLine: {
show: false
}
},
radiusAxis: {
zlevel: 0,
min: 0,
max: 100,
interval: 25,
axisLabel: {
textStyle: {
color: '#AFAFAF',
fontSize: 10
}
},
axisLine: {
show: false
},
splitLine: {
show: false
},
splitArea: {
show: false
}
},
series: buildSeries(yData)
};
let currentIndex = -1;
setInterval(() => {
let dataLen = option.series[0].data[0].value.length + 1;
// 取消之前高亮的图形
myChart.dispatchAction({
type: 'downplay',
seriesIndex: currentIndex,
dataIndex: 0
});
currentIndex = (currentIndex + 1) % dataLen;
// 高亮当前图形
myChart.dispatchAction({
type: 'highlight',
seriesIndex: currentIndex,
dataIndex: 0
});
// 显示 tooltip
myChart.dispatchAction({
type: 'showTip',
seriesIndex: currentIndex,
dataIndex: 0
});
}, 2000);
希望我的愚见能够帮助你哦~,若有不足之处,还望指出,你们有更好的解决方法,欢迎大家在评论区下方留言支持,大家一起相互学习参考呀~
|