Python读取Excel数据并进行函数拟合 |
您所在的位置:网站首页 › python调用表格数据 › Python读取Excel数据并进行函数拟合 |
Python读取Excel数据并进行函数拟合
|
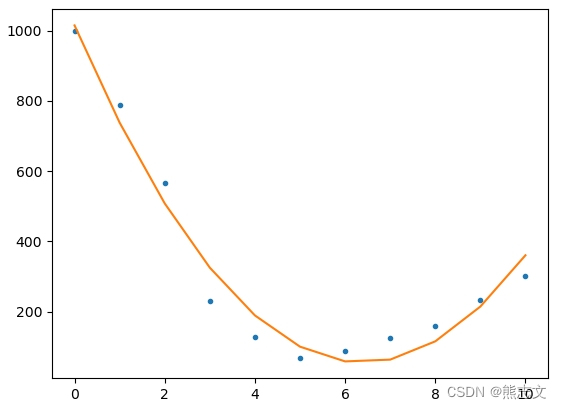
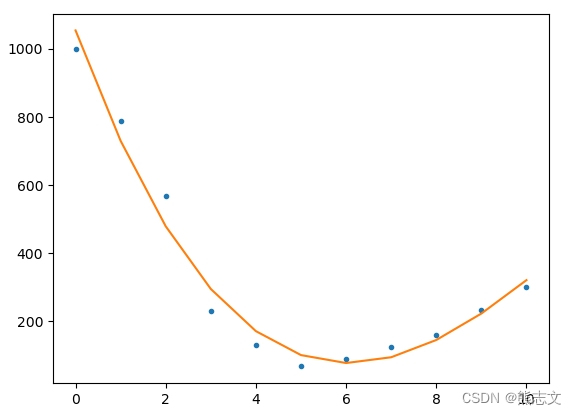
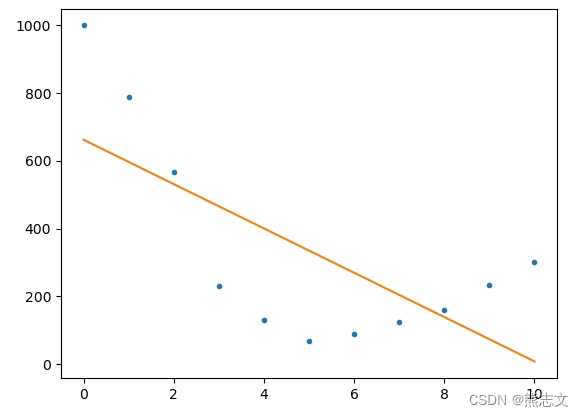
数据分析过程中,需要对数据趋势进行分析,利用Python进行数据拟合是一种不错的方式,下列以一次、二次、三次函数拟合为例,对下表demo数据进行不同拟合,最终生成函数和曲线。 # -*- coding: utf-8 -*- import openpyxl from datashape import string from openpyxl import load_workbook import numpy as np import matplotlib.pyplot as plt x_data = [] y_data = [] workbook = openpyxl.load_workbook('D:/data/test.xlsx') sheet = workbook['Sheet1'] for i in range(11): x_data.append(sheet.cell(row=(i+2), column=1).value) y_data.append(sheet.cell(row=(i+2), column=2).value) x = np.array(x_data) y = np.array(y_data) # 尝试一次函数拟合 parameter = np.polyfit(x, y, 1) # 1代表一次函数,拟合出的函数被y1调用 y1 = parameter[0] * x + parameter[1] p = np.poly1d(parameter, variable='x') # 根据拟合参数,用ploy1d构建函数表达式 print(p) correction = np.corrcoef(y, y1)[0, 1] # 用corrcoef方法得出相关系数R,输入R2表示决定系数,用于判断拟合程度 print(correction ** 2) print(parameter) plt.plot(x, y, '.') plt.plot(x, y1) plt.show() # 尝试二次函数 parameter = np.polyfit(x, y, 2) y1 = parameter[0] * x**2 + parameter[1] * x + parameter[2] p = np.poly1d(parameter, variable='x') # 根据拟合参数,用ploy1d构建函数表达式 print(p) correction = np.corrcoef(y, y1)[0, 1] print(correction ** 2) print(parameter) plt.plot(x, y, '.') plt.plot(x, y1) plt.show() # 尝试三次函数 parameter = np.polyfit(x, y, 3) y1 = parameter[0] * x ** 3 + parameter[1] * x ** 2 + parameter[2] * x + parameter[3] p = np.poly1d(parameter, variable='x') # 根据拟合参数,用ploy1d构建函数表达式 print(p) correction = np.corrcoef(y, y1)[0, 1] print(correction ** 2) print(parameter) plt.plot(x, y, '.') plt.plot(x, y1) plt.show()
Excel数据Demo x y 0 1000 1 789 2 567 3 230 4 129 5 67 6 88 7 124 8 160 9 233 10 300
|
【本文地址】