python 自定义图例(legend) |
您所在的位置:网站首页 › python绘图图例位置设置 › python 自定义图例(legend) |
python 自定义图例(legend)
|
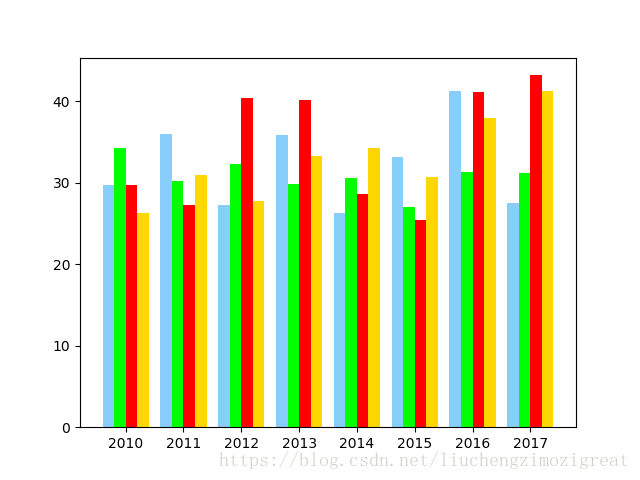
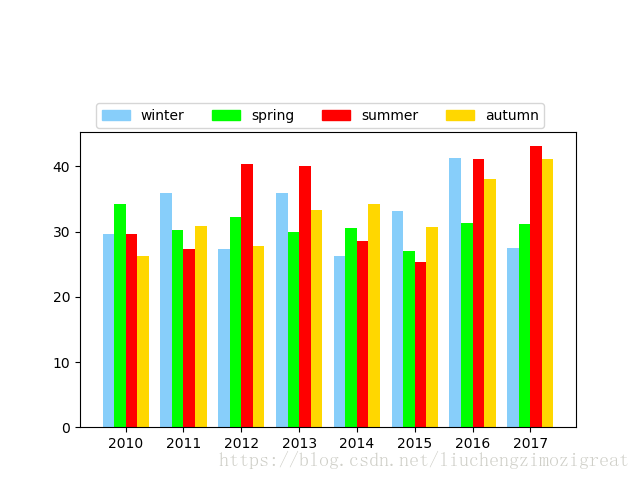
背景:不是所有的句柄(handles)都可以自动转化成legend,所以有必要自己创建一个artist来实现此功能,可参考一下下面官方的文档: Creating artists specifically for adding to the legend (aka. Proxy artists)文档只创建了一个图例,比如我有下图,我就需要四个图例: 我想根据色条创建四个图例,并添加相应地label,这时我们可以自定义颜色和label来创建图例,相关代码如下(我想注释写的很详细了,这是参考): import matplotlib.pyplot as plt import matplotlib.patches as mpatches import numpy as np if __name__ == '__main__': max_lst_of_all = {} #一个字典,value是四季最大阵风的风速值,key是年份 max_lst_of_all[2010] = [29.7, 34.3, 29.7, 26.3] max_lst_of_all[2011] = [36.0, 30.2, 27.3, 30.9] max_lst_of_all[2012] = [27.3, 32.3, 40.4, 27.8] max_lst_of_all[2013] = [35.9, 29.9, 40.1, 33.3] max_lst_of_all[2014] = [26.3, 30.6, 28.6, 34.3] max_lst_of_all[2015] = [33.1, 27.0, 25.4, 30.7] max_lst_of_all[2016] = [41.3, 31.3, 41.1, 38.0] max_lst_of_all[2017] = [27.5, 31.2, 43.2, 41.2] fig = plt.figure() for key in max_lst_of_all.keys(): print(max_lst_of_all[key]) x = np.arange(key-0.3, key+0.31, 0.2) #一年有四季,此行指定四季对应的bar的位置,比如2010年:2009.7,2009.9,2010.1,2010.3 y = max_lst_of_all[key] #此行决定了bar的高度(风速值) #bar_width = 0.2 color = ['lightskyblue', 'lime', 'red', 'gold'] #指定bar的颜色 for x1, y1, c1 in zip(x, y, color): #遍历以上三者,每一次生成一条bar plt.bar(x1, y1, width=0.2, color=c1) #我试过这里不能直接生成legend,解决方法就是自己定义,创建legend labels = ['winter', 'spring', 'summer', 'autumn'] #legend标签列表,上面的color即是颜色列表 #用label和color列表生成mpatches.Patch对象,它将作为句柄来生成legend patches = [ mpatches.Patch(color=color[i], label="{:s}".format(labels[i]) ) for i in range(len(color)) ] ax=plt.gca() box = ax.get_position() ax.set_position([box.x0, box.y0, box.width , box.height* 0.8]) #下面一行中bbox_to_anchor指定了legend的位置 ax.legend(handles=patches, bbox_to_anchor=(0.95,1.12), ncol=4) #生成legend plt.show()关于图例位置可参考链接,说的不是很明白,但自己试一下,会发现有用。 最后得到的结果如下:
|
【本文地址】
今日新闻 |
推荐新闻 |