Automating DrawIO network topology using Python |
您所在的位置:网站首页 › python代码生成drawio › Automating DrawIO network topology using Python |
Automating DrawIO network topology using Python
|
Intro
In this blog , we are going to show how to use the draw_network_plot python library to generate a DrawIO Network topology easily instead of manually drawing them yourself . DrawIO is widely used as a free alternative to Microsoft's Visio to draw network topologies. I will be using Netmiko and CDP to acquire the data needed for the plot for the devices themselves , but this part won't be the focus of the article . Focus of the article is how to use the "drawio_network_plot" library" to generate the DrawIO file . Library setupMake sure to have Python 3.7 and above , then install the library using : $ pip install drawio_network_plot Lab setupLab is done on EVE-NG using Cisco's 7200VXR image to create the topology , the whole topology is L3 with Loopback so the Python CentOS server would be able to ssh to each device . EVE-NG Topology Diagram (Non-generated):
You can find both the below script and all the EVE-NG Cisco devices configuration in the following Github Link : drawio_network_plot/examples/cisco_gather_cdp_and_plot from netmiko import ConnectHandler import re from drawio_network_plot.drawio_network_plot import NetPlot # ----------------- Getting live CDP Neigbors to gather links endpoints --------------------------- def retieve_lldp_neigbor_hostname(devices_list): list_of_cdp_neighborship = [] for device in devices_list: device_dictionary = { 'device_type': 'cisco_ios', 'host': device['ip_address'], 'username': 'automation', 'password' : '1234567', } net_connect = ConnectHandler(**device_dictionary) output = net_connect.send_command("show cdp neighbor") lines_list = output.splitlines() for line in lines_list: try: # regex to search the name of the device before the domain ID ".default" , then removing the word ".default" from the string link = { 'sourceNodeID' : device['nodeName'], 'destinationNodeID' : re.search('\S+\.default',line).group().replace('.default','') } # checking for duplication before adding new link : if {'sourceNodeID':link['destinationNodeID'],'destinationNodeID':link['sourceNodeID']} not in list_of_cdp_neighborship: list_of_cdp_neighborship.append(link) except: continue net_connect.disconnect() return list_of_cdp_neighborship def main(): # Lab Devices , must have the device type for the plotting library to work devices = [ {'nodeName':'Router_1','ip_address':'100.0.1.1','nodeType':'router','nodeDescription':'NA'}, {'nodeName':'Router_2','ip_address':'100.0.1.2','nodeType':'router','nodeDescription':'NA'}, {'nodeName':'Spine_1','ip_address':'100.0.2.1','nodeType':'l3_switch','nodeDescription':'NA'}, {'nodeName':'Spine_2','ip_address':'100.0.2.2','nodeType':'l3_switch','nodeDescription':'NA'}, {'nodeName':'Leaf_1','ip_address':'100.0.3.1','nodeType':'l2_switch','nodeDescription':'NA'}, {'nodeName':'Leaf_2','ip_address':'100.0.3.2','nodeType':'l2_switch','nodeDescription':'NA'}, {'nodeName':'Leaf_3','ip_address':'100.0.3.3','nodeType':'l2_switch','nodeDescription':'NA'} ] # Getting list of links for each device list_of_cdp_neighborship = retieve_lldp_neigbor_hostname(devices) for peering in list_of_cdp_neighborship: print(peering) # ------------------------------------------------------------------------------------------------------ # ------------------------------------------------------------------------------------------------------ # ----------------- Main Part : using library to generate XML DrawIIO format --------------------------- # Using the Plot library x = NetPlot() x.addNodeList(devices) x.addLinkList(list_of_cdp_neighborship) print(x.display_xml()) # ------------------------------------------------------------------------------------------------------ # ------------------------------------------------------------------------------------------------------ # ------------------------------------------------------------------------------------------------------ if __name__ == "__main__": main() Enter fullscreen mode Exit fullscreen mode Library OptionsRemember , you can gather the data however you like , this was just a simple demonstration of what you can do , main code to remember is the plotting part : # please adhere to the naming scheme in the variables device_list = [{'nodeName' : 'TOR_1','nodeType' : 'l2_switch','nodeDescription' : 'Leaf Switch 01'}] x = NetPlot() # **IMPORTANT NOTE :**---> Make sure that the sourceNode in the connection is the higher level device and that connections are not replicated , this way when you use the DrawIO automatic layout , it would create the diagram hierarchy the correct way connections_list = [{'sourceNodeID' : 'Router_1','destinationNodeID' : 'Core_switch_1'}] # Adding using list all at once x.addNodeList(device_list) x.addLinkList(connections_list) # Adding node by node and link by link x.addNode(nodeName='Router_18',nodeType='router') x.addLink('Router_17','Router_18') # --- Output --- # You can print the XML to the Stdout print(x.display_xml()) # Or You can also directly generate an XML file using the built in function : # x.exportXML('examples/output.xml') Enter fullscreen mode Exit fullscreen modeGenerated output will be collapsed in one point , you will have to choose the Layout you would like in DrawIO after opening the file like showed as follows : Generated Topology1- Open generated XML file in DrawIO
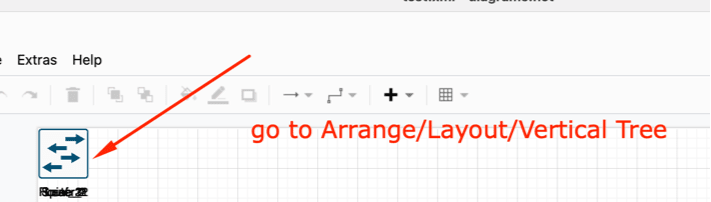
2- go to Arrange/Layout/Vertical Tree
3- Final Result
For any comment on the pip package , feature addition or any comment , please share your suggestions as this is my 1st PIP library , and divinely its not perfect . Thanks ... |


【本文地址】
今日新闻 |
推荐新闻 |