Python读取csv文件做K |
您所在的位置:网站首页 › pandas聚类分析怎么做 › Python读取csv文件做K |
Python读取csv文件做K
|
1.运行环境及数据
Python3.7、PyCharm Community Edition 2021.1.1,win10系统。 使用的库:matplotlib、numpy、sklearn、pandas等 数据:CSV文件,包含时间,经纬度,高程等数据 2.基于时间序列的分析2D读取时间列和高程做一下分析: 代码如下: from PIL import Image import matplotlib.pyplot as plt import numpy as np from sklearn.cluster import KMeans, MiniBatchKMeans import pandas as pd if __name__ == "__main__": data = pd.read_csv(r"H:\CSDN_Test_Data\UseYourTestData.csv") x, y = data['Time (sec)'], data['Height (m HAE)'] n = len(x) x = np.array(x) x = x.reshape(n, 1)#reshape 为一列 y = np.array(y) y = y.reshape(n, 1)#reshape 为一列 data = np.hstack((x, y)) #水平合并为两列 k = 8 # 设置颜色聚类的类别个数(我们分别设置8,16,32,64,128进行对比) cluster = KMeans(n_clusters=k) # 构造聚类器 C = cluster.fit_predict(data) # C_Image = cluster.fit_predict(data) plt.figure() plt.scatter(data[:, 0], data[:, 1], marker='o', s=2, c=C) plt.show()结果展示: 2.1 2000行数据结果展示
CPU立马90%以上了。大约1-2分钟,也比较快了。
markersize有些大了, 将markersize改小一些显示,设置为0.1,点太多还是不明显。
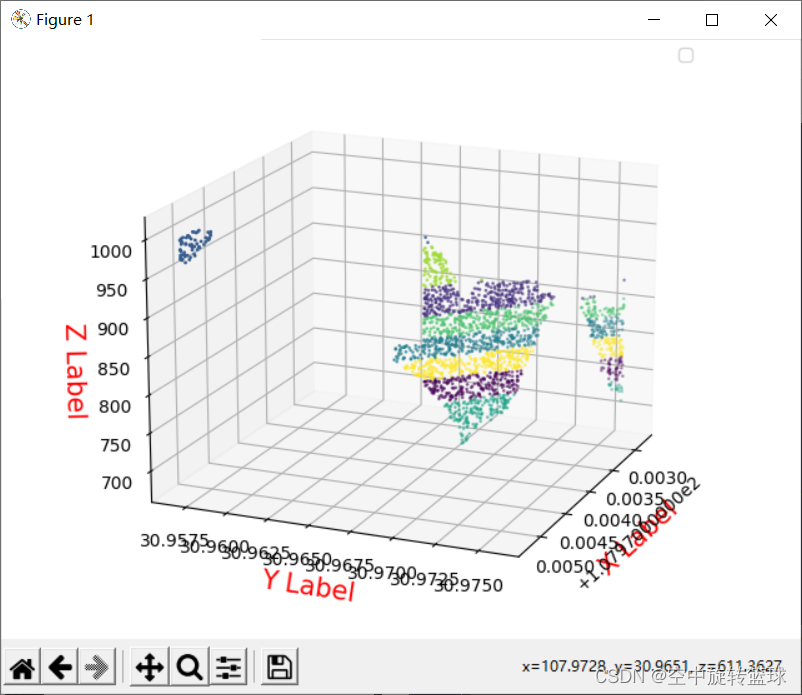
修改代码,读取相应的列修改为X,Y,Z坐标:如下: from PIL import Image import matplotlib.pyplot as plt import numpy as np from sklearn.cluster import KMeans, MiniBatchKMeans import pandas as pd from mpl_toolkits.mplot3d import Axes3D if __name__ == "__main__": data = pd.read_csv(r"H:\CSDN_Test_Data\UseYourTestData.csv") x, y,z = data['Longitude (deg)'],data['Latitude (deg)'], data['Height (m HAE)'] n = len(x) x = np.array(x) x = x.reshape(n, 1)#reshape 为一列 y = np.array(y) y = y.reshape(n, 1)#reshape 为一列 z = np.array(z) z = z.reshape(n, 1) # reshape 为一列 data = np.hstack((x, y, z)) #水平合并为两列 k = 8 # 设置颜色聚类的类别个数(我们分别设置8,16,32,64,128进行对比) cluster = KMeans(n_clusters=k) # 构造聚类器 C = cluster.fit_predict(data) # C_Image = cluster.fit_predict(data) fig = plt.figure() ax = Axes3D(fig) ax.scatter(data[:, 0], data[:, 1],data[:, 2], s=1, c=C) # 绘制图例 ax.legend(loc='best') # 添加坐标轴 ax.set_zlabel('Z Label', fontdict={'size': 15, 'color': 'red'}) ax.set_ylabel('Y Label', fontdict={'size': 15, 'color': 'red'}) ax.set_xlabel('X Label', fontdict={'size': 15, 'color': 'red'}) plt.show() 3.1 2000行数据结果显示由于经度在纬度方向上在17m范围类,所以立体效果较差,可以换其他数据测试。
105万行数据显示结果:
我们将输出结果读取出来,保存到原始csv文件的最后一列中,将这段代码添加到最后。 C1=np.array(C) #C是一个list,包含多个类别 C1=C1.reshape(n,) #将C转为C1,转化为原始行数你,即变成了一列list数据 print(C1) data["K-mean_Cluster"] = C1 output_path_file="your_output_full_path" #输出完整路径 data.to_csv(output_path_file, index=False) # 把数据写入数据集,index=False表示不加索引C结果是一个list,结果如下: [2 2 2 ... 0 5 0] 完整代码为: from PIL import Image import matplotlib.pyplot as plt import numpy as np from sklearn.cluster import KMeans, MiniBatchKMeans import pandas as pd if __name__ == "__main__": data = pd.read_csv(r"H:\CSDN_Test_Data\UseYourTestData.csv") x, y = data['Time (sec)'], data['Height (m HAE)'] n = len(x) x = np.array(x) x = x.reshape(n, 1)#reshape 为一列 y = np.array(y) y = y.reshape(n, 1)#reshape 为一列 Z = np.hstack((x, y)) #水平合并为两列 k = 8 # 设置颜色聚类的类别个数(我们分别设置8,16,32,64,128进行对比) cluster = KMeans(n_clusters=k) # 构造聚类器 C = cluster.fit_predict(Z) plt.figure() plt.scatter(Z[:, 0], Z[:, 1], marker='o', s=2, c=C) plt.show() C1=np.array(C) #C是一个list,包含多个类别 C1=C1.reshape(n,) #将C转为C1,转化为原始行数你,即变成了一列list数据 print(C1) data["K-mean_Cluster"] = C1 output_path_file="your_output_full_path" #输出完整路径 data.to_csv(output_path_file, index=False) # 把数据写入数据集,index=False表示不加索引 |


【本文地址】
今日新闻 |
推荐新闻 |