条形图上的误差棒应该用SD还是SE? |
您所在的位置:网站首页 › origin怎么画误差棒的条形图 › 条形图上的误差棒应该用SD还是SE? |
条形图上的误差棒应该用SD还是SE?
|
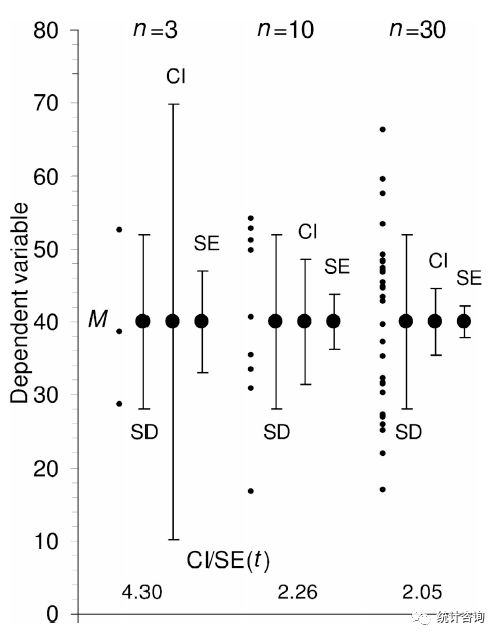
误差棒对应的样本量须在图例中说明。如下图,随着样本量的增大,标准差SD可能几乎不变,但置信区间CI和标准误SE会明显变窄。
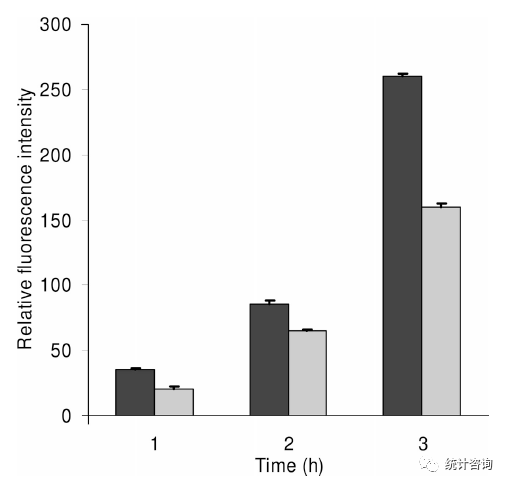
准则3 Error bars and statistics should only be shown for independently repeated experiments, and never for replicates. 误差棒应用于独立的重复试验,而非重复样本。如下图,对重复样本 (可能是同一样本) 的酶活性进行统计描述,使得误差棒范围非常小,作用不大。
准则4 Because experimental biologists are usually trying to compare experimental results with controls, it is usually appropriate to show inferential error bars, such as SE or CI, rather than SD. However, if n is very small (for example n = 3), rather than showing error bars and statistics, it is better to simply plot the individual data points. 由于实验生物学家通常将实验组与对照组进行比较,此时用推断性质的误差棒 (如:标准误SE或置信区间CI) 比标准差SD更合适。但当样本量较少 (如:n=3) 时,直接给出各个数据点的分布,要比给出任一种误差棒更好。如准则2中的图。 准则5 95% CIs capture μ on 95% of occasions, so you can be 95% confident your interval includes μ. SE bars can be doubled in width to get the approximate 95% CI, provided n is 10 or more. If n = 3, SE bars must be multiplied by 4 to get the approximate 95% CI. 标准误SE与95%置信区间CI的关系可以从图中直观判断,当样本量大于10时,95%CI的宽度约为SE的两倍,而样本量为3时,95%CI的宽度约为SE的四倍。如准则2中的图。 准则6 When n = 3, and double the SE bars don't overlap, P < 0.05, and if double the SE bars just touch, P is close to 0.05. If n is 10 or more, a gap of SE indicates P ≈ 0.05 and a gap of 2 SE indicates P ≈ 0.01. 当样本量为3时,两倍的标准误棒没有重叠,表示P |
【本文地址】
今日新闻 |
推荐新闻 |