|
Python----opencv识别细胞核质、手动调整阈值与阈值的自动检测
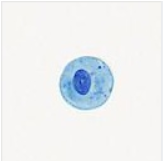
一、题目:根据附件 cell.jpg,使用 opencv 库或者 PIL 库计算细胞核与细胞质的面积比。
二、逐步分解,逐步攻破
1.借助Photoshop初步分析图片
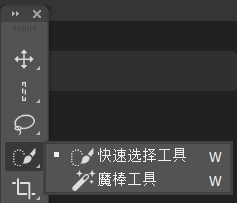
1.1 借助魔棒工具或快速选择工具
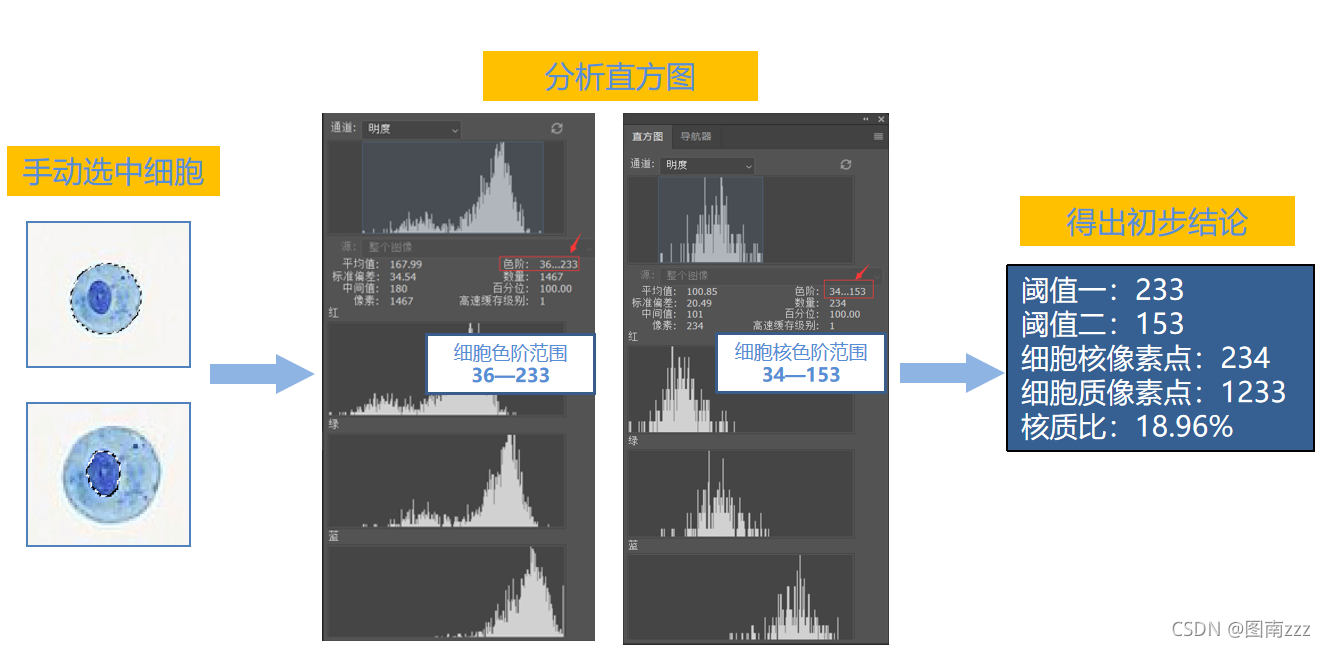
1.2 两次分别选择细胞核和整个细胞

1.3 借助Photoshop的直方图的明度(转化为灰度图)来观察

1.4初步得出结论
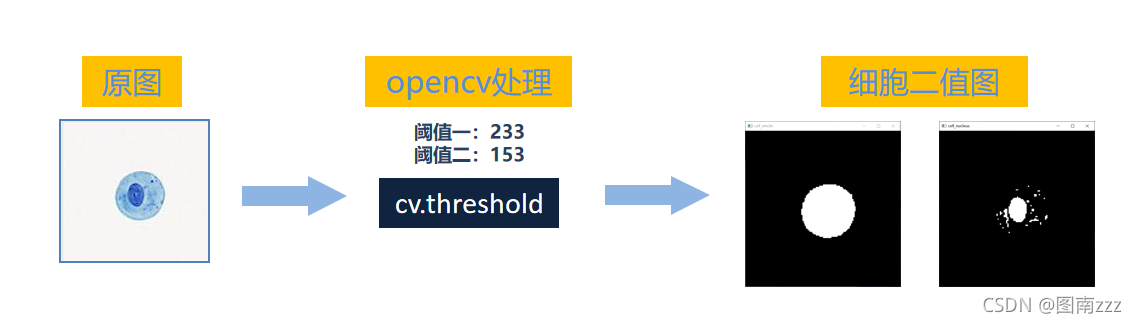
2. 借助刚刚得到的阈值和opencv库得到细胞的二值图
cell = cv.cvtColor(cell_o, cv.COLOR_BGR2GRAY)
rows, cols = cell_o.shape[:2] # 获得图片的高和宽
mapx = np.zeros(cell_o.shape[:2], np.float32) # mapx是一个图片大小的变换矩阵
mapy = np.zeros(cell_o.shape[:2], np.float32) # mapy也是一个图片大小的变换矩阵
for i in range(rows): # 遍历,将获得到图片的宽和稿依次赋予两个变换矩阵
for j in range(cols):
mapx.itemset((i, j), j)
mapy.itemset((i, j), i)
ret, cell_2v_whole = cv.threshold(cell, x1, 255, cv.THRESH_BINARY_INV) # 获取整个细胞的二值图
ret, cell_2v_nucleus = cv.threshold(cell, x2, 255, cv.THRESH_BINARY_INV) # 获取细胞核的二值图
cv.namedWindow("cell_whole", 0)
cv.resizeWindow("cell_whole", 500, 500)
cv.imshow("cell_whole", cell_2v_whole)
cv.namedWindow("cell_nucleus", 0)
cv.resizeWindow("cell_nucleus", 500, 500)
cv.imshow("cell_nucleus", cell_2v_nucleus)
3.借助opencv描绘出二值图的最大轮廓,并用椭圆拟合
这一步使用opencv处理细胞核质比的关键,通过Photoshop得到的两个阈值,我们已经基本能够得到细胞核和细胞质的轮廓的。但是通过观察上面的二值图可以发现,其实仅仅通过这两个阈值来用opencv提取的话,会有很多细胞质中的深度点被误当成细胞核的部分,因此如果直接用二值图的面积来计算的话,会导致结果及其不准确。
提取最大轮廓 因为细胞核、细胞质是成块出现的,所以在我们只需要找到最大的一个封闭的轮廓就可以了 椭圆拟合 使用椭圆拟合最大的轮廓,是为了让计算更加精确,opencv是有直接的方法来做到这一点的,而椭圆的面积是有直接的公式可以计算的,即:S=Π×a×b。 并且使用椭圆拟合后的面积与最大轮廓面积的误差值可以作为一个新的十分重要的数据存在。
import cv2 as cv
# 基于二值图像用外轮廓的模式,通过全点连接轮廓的方法提取轮廓
contours_whole, hierarchy = cv.findContours(cell_2v_whole, cv.RETR_EXTERNAL, cv.CHAIN_APPROX_NONE)
contours_nucleus, hierarchy = cv.findContours(cell_2v_nucleus, cv.RETR_EXTERNAL, cv.CHAIN_APPROX_NONE)
# 获取目标图像的最小矩阵,找到最大的轮廓
maxArea = 0
maxContour = {}
for item in contours_whole:
x, y, w, h = cv.boundingRect(item)
if w * h > maxArea:
maxArea = w * h
maxContour = item
whole_area = 0
whole_area += cv.contourArea(maxContour)
img = cv.drawContours(cell_o.copy(), maxContour, -1, (0, 255, 0), 1)
cnt = maxContour
ellipse = cv.fitEllipse(cnt)
(x, y), (a, b), angle = cv.fitEllipse(cnt)
cv.ellipse(img, ellipse, (255, 0, 0), 1)
whole_area_ellipse = math.pi * a * b / 4
# 重复,查找细胞核的最大轮廓
maxArea = 0
maxContour = {}
for item in contours_nucleus:
x, y, w, h = cv.boundingRect(item)
if w * h > maxArea:
maxArea = w * h
maxContour = item
nucleus_area = 0
nucleus_area += cv.contourArea(maxContour)
img = cv.drawContours(img, maxContour, -1, (0, 0, 255), 1)
cnt = maxContour
ellipse = cv.fitEllipse(cnt)
(x, y), (a, b), angle = cv.fitEllipse(cnt)
cv.ellipse(img, ellipse, (255, 0, 0), 1)
nucleus_area_ellipse = math.pi * a * b / 4

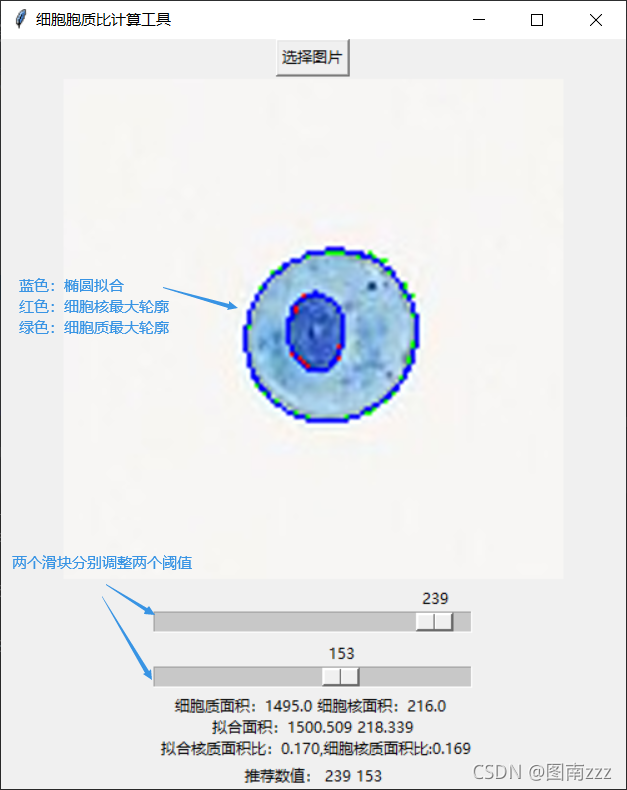
4. 借助Python的GUI界面手动调整阈值,观察数据

5.绘制不同阈值下,椭圆拟合面积和最大轮廓面积误差值折线图
for i in range(0, 256):
scaleX1.set(i)
scaleX2.set(100)
try:
whole_area, nucleus_area, whole_area_ellipse, nucleus_area_ellipse = runDetect(i, 100)
ls.append(abs(whole_area - whole_area_ellipse))
except Exception:
ls.append(0.1)
# runDetect函数就是绘制最大轮廓和椭圆拟合的函数,3、4都是其部分代码
# 这里是将阈值从0-255遍历一次,获得各阈值下的核质误差值加入到一个列表中,用于绘制折线图和之后的分析。

6. 根据误差值折线图特性,自定义函数自动查找两个阈值

分析两个正确阈值的数据特点
误差值很小,趋近于0处于误差值的上升突变点处于三个峰的右边两个峰的左侧 转化为数值
right > mean * leftleft != 0abs(ls[i] - ls[i -1]) > 0.010 < ls[i] < mean2
def slopeComparison(i,ls,ls1):
left = abs(ls[i] - ls[i - 1]) + abs(ls[i-1] - ls[i-2]) # 左侧变化率
right = ls[i+2] - ls[i] # 右侧变化率
mean = np.mean(ls1) # 误差值变化率平均值
mean2 = np.mean(ls) # 误差值平均值
if right > mean * left and left != 0 and (abs(ls[i] - ls[i - 1]) > 0.01) and 0 0.01) and 0 }
for item in contours_nucleus:
x, y, w, h = cv.boundingRect(item)
if w * h > maxArea:
maxArea = w * h
maxContour = item
nucleus_area = 0
nucleus_area += cv.contourArea(maxContour)
img = cv.drawContours(img, maxContour, -1, (0, 0, 255), 1)
cnt = maxContour
ellipse = cv.fitEllipse(cnt)
(x, y), (a, b), angle = cv.fitEllipse(cnt)
cv.ellipse(img, ellipse, (255, 0, 0), 1)
nucleus_area_ellipse = math.pi * a * b / 4
# img = cv.rectangle(img,(x,y),(x+w,y+h),(0,255,0),1)
changePic(img)
# 绘制目标框
words['text'] = "细胞质面积:{} 细胞核面积:{} \n 拟合面积:{:.3f} {:.3f} \n 拟合核质面积比:{:.3f},细胞核质面积比:{:.3f}".format(whole_area,
nucleus_area,
whole_area_ellipse,
nucleus_area_ellipse,
nucleus_area_ellipse / (whole_area_ellipse - nucleus_area_ellipse),
nucleus_area / (whole_area - nucleus_area)
)
return whole_area, nucleus_area, whole_area_ellipse, nucleus_area_ellipse
def handleLeftButtonReleaseEvent(e):
global scaleX1
global scaleX2
runDetect(scaleX1.get(), scaleX2.get())
root = Tk()
root.geometry('500x600')
root.title('细胞胞质比计算工具')
cell_o = cv.imread("../cell.jpg", 1)
path = StringVar()
Button(root, text='选择图片', command=choosepic).pack()
file_entry = Entry(root, state='readonly', text=path)
# file_entry.pack()
image_label = Label(root)
image_label.pack()
scaleX1 = Scale(root, from_=0, to=255, orient=HORIZONTAL, length=255)
scaleX2 = Scale(root, from_=0, to=255, orient=HORIZONTAL, length=255)
scaleX1.bind("", handleLeftButtonReleaseEvent)
scaleX2.bind("", handleLeftButtonReleaseEvent)
scaleX1.pack()
scaleX2.pack()
words = Label(root)
words.pack()
rec = Label(root)
rec.pack()
# plt.plot(list(ls),list(range(1,256)),linewidth=1,color='r',marker='o',markersize=0)
# plt.xlabel('Position(2-Theta)')
# plt.ylabel('Intensity')
# plt.legend()
# plt.show()
root.mainloop()
|