Jupyter notebook最简原型界面设计 |
您所在的位置:网站首页 › notebook字体设计 › Jupyter notebook最简原型界面设计 |
Jupyter notebook最简原型界面设计
|
Tkinter的GUI设计 和 django页面设计,那么笔者只是想快速做个demo原型,以上的内容能不能结合着来,有一些简单的交互 + web可以快速访问的到,于是就看到了jupyter notebook这两个库,非常简单的玩具,来看看呗~ ipywidgets比较强调输入项的各式花样,但是其对输出内容的格式的花样非常少。 文章目录 一 ipywidgets1.1 基础组件1.1.1 button 按钮1.1.2 IntSlider、FloatSlider1.1.3 FloatProgress / IntProgress1.1.4 Text、Textarea1.1.5 图片Image 1.2 单控件 - interact 简单交互1.3 单控件 - interact_manual简单交互1.4 单控件 - interactive_output + HBox交互1.5 单控件 - 文本交互1.6 两个控件 - 组合交互jslink1.7 多模块 - 控件独立分屏Accordion1.8 一些小案例1.8.1 图形 + 滑块1.8.2 一个可控的进度读条1.8.3 颜色筛选器1.8.4 复杂输入框 二 lineup_widget2.1 安装2.2 主函数2.3 案例案例一:案例二: 2.4 ipywidgets与lineup_widget共同使用的案例 三 相似的Jupyter画图小模块3.1 d3-slider widget3.2 drawing-pad3.3 ipypivot 一 ipywidgets文档:https://ipywidgets.readthedocs.io/en/stable/index.html github:https://github.com/jupyter-widgets/ipywidgets 安装: # 方式一 pip install ipywidgets jupyter nbextension enable --py widgetsnbextension # 方式二 conda install -c conda-forge ipywidgets效果:
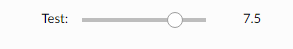
来看一些组件与模块。 1.1 基础组件主要参考:Widget List 1.1.1 button 按钮 widgets.Button( description='Click me', disabled=False, button_style='success', # 'success', 'info', 'warning', 'danger' or '' tooltip='Click me', icon='check' ) # 调整按钮 from ipywidgets import Button, Layout b = Button(description='(50% width, 80px height) button', layout=Layout(width='50%', height='80px'), button_style='success') bbutton是作为输入项的, 一个整数型滑块,一个数值型滑块。 一个整数型进度条,一个数值型进度条。 一般来说,textarea比text更好用,模块是可伸缩的。
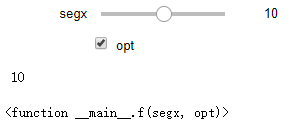
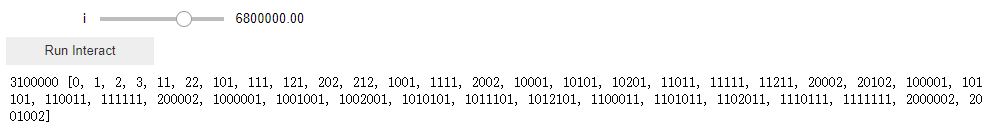
interact代表交互,第一个f代表函数,segx与opt都代表f函数的参数。 segx代表滑条opt = True/False代表选项框注意interact,相当于给函数f赋值,除了第一个,之后的参数都是第一个函数的参数,名字需对齐。 1.3 单控件 - interact_manual简单交互 from ipywidgets import FloatSlider # 横轴进度可以拖拽 def slow_function(i): print(int(i),list(x for x in range(int(i)) if str(x)==str(x)[::-1] and str(x**2)==str(x**2)[::-1])) return interact_manual(slow_function,i=FloatSlider(min=1e5, max=1e7, step=1e5));FloatSlider表示拖拽滑块,interact_manual(函数,函数参数),此时函数参数是由拖拽滑块FloatSlider来确定。 与interact的区别: interact是实时改变,interact_manual是人工点击RUN才能执行一次。 a,b,c是三个滑块,通过widgets.HBox进行拼接成为一个Box组件。 interactive_output(函数,函数参数),函数参数是一个组合Box组件。 display是展示滑块组合以及输出项。
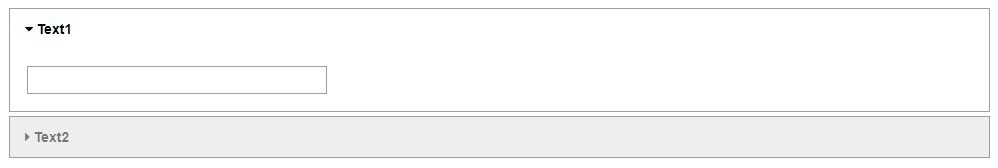
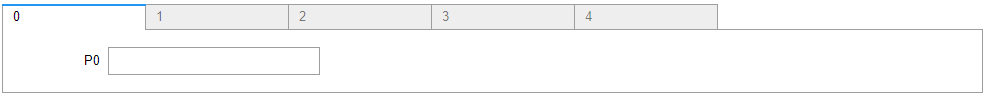
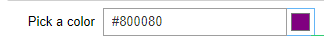
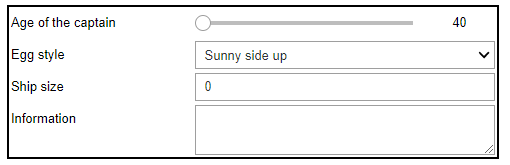
jslink把控件a,b组合起来,a是文本控件,b是数值控件。 可以把两个组件独立的链接在一起,而不是如jslink交互影响。 多个控件独立组合。 多个控件组合独立分开。 interactive(函数,函数参数),m/b都是可变滑块。 第二个案例: 来着:Mastering widgets in the Jupyter Notebook @widgets.interact_manual( color=['blue', 'red', 'green'], lw=(1., 10.)) def plot(freq=1., color='blue', lw=2, grid=True): t = np.linspace(-1., +1., 1000) fig, ax = plt.subplots(1, 1, figsize=(8, 6)) ax.plot(t, np.sin(2 * np.pi * freq * t), lw=lw, color=color) ax.grid(grid)interact_manual是单控件函数交互,此时通过装饰器,interact_manual(函数,函数参数)中的函数被隐去。 Play是一个控制按钮,FloatProgress是一个数值进度条。 通过jslink将两个空间链接,点击按钮就Loading就可以开始走动。 点击之后就会出现颜色筛选内容,筛选出来的结果为该颜色的具体数值,#800080 form_item_layout统一的Box布局, Dropdown是下拉框,一个Box是一个独立组件。 form_items是多个Box的组合,Box( [Label(),Textarea()] , layout ) => Box( [前缀名,控件函数] , 布局 ) . 二 lineup_widgetgithub:https://github.com/datavisyn/lineup_widget 这是一个专门为展示dataframe + ipywidgets而来的包。 参考:Jupyter Widget 2.1 安装 ## install Jupyter Widgets pip install ipywidgets jupyter nbextension enable --py widgetsnbextension ## install library pip install lineup_widget jupyter nbextension enable --py --sys-prefix lineup_widget 2.2 主函数w = lineup_widget.LineUpWidget(df, options=dict(rowHeight=20)) _data = List(trait=Dict(), default_value=[]).tag(sync=True) _columns = List(trait=Dict(), default_value=[]).tag(sync=True) options = Dict(traits=dict(filterGlobally=Bool(), singleSelection=Bool(), noCriteriaLimits=Bool(), animated=Bool(), sidePanel=Enum((True, False, 'collapsed')), summaryHeader=Bool(), overviewMode=Bool(), hierarchyIndicator=Bool(), labelRotation=Int(), ignoreUnsupportedBrowser=Bool(), rowHeight=Int(), rowPadding=Int(), groupHeight=Int(), groupPadding=Int(), expandLineOnHover=Bool(), defaultSlopeGraphMode=Enum(('item', 'band'))), default_value=dict(filterGlobally=True, singleSelection=False, noCriteriaLimits=False, animated=True, sidePanel='collapsed', summaryHeader=True, overviewMode=False, hierarchyIndicator=True, labelRotation=0, ignoreUnsupportedBrowser=False, rowHeight=18, rowPadding=2, groupHeight=40, groupPadding=5, expandLineOnHover=False, defaultSlopeGraphMode='item' )).tag(sync=True) rankings = List(trait=Dict(traits=dict(columns=List(trait=Union((Unicode(), Dict()))), sort_by=List(trait=Unicode()), group_by=List(trait=Unicode())), default_value=dict(columns=['_*', '*'], sort_by=[], group_by=[])), default_value=[]).tag( sync=True)其中options之中有非常多的参数,由于文档也没具体说明,笔者这边只对几个参数有了解。 其中:sidePanel=Enum((True, False, 'collapsed'))代表侧边的面板是否打开,笔者觉得很碍人,一般是sidePanel = False 2.3 案例 案例一: import lineup_widget import pandas as pd import numpy as np df = pd.DataFrame(np.random.randint(0,100,size=(100, 4)), columns=list('ABCD')) w = lineup_widget.LineUpWidget(df) w.on_selection_changed(lambda selection: print(selection)) w非常简单,唯一需要整理的就是df,一个DataFrame的格式作为输入,其他不用调整任何东西,就可以使用了。 如下图,里面的内容就是可以单独对df这个数据框进行筛选,用display展示出来。
参考于:Authoring Custom Jupyter Widgets 3.1 d3-slider widgetThis custom d3-slider widget wraps a simple custom slider based on the fantastic d3.js library. You can run and try it on the Binder repo or watch it on nbviewer. pip install jupyter_widget_d3_slider
This small drawing pad app, is inspired from this codepen. You can run and try it on the Binder repo or watch it on nbviewer. pip install jupyter-drawing-padThe ipypivot widget, wraps the convenient PivotTable.js library. You can run and try it on the binder repo or watch it on nbviewer. pip install ipypivot |
 (参考自:A very simple demo of interactive controls on Jupyter notebook)
 (参考于:Interactive Visualizations In Jupyter Notebook)


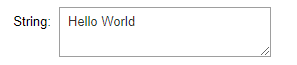 Textarea是一个比较长的文本框作为输入项。


【本文地址】
今日新闻 |
推荐新闻 |