|
1、Theil-Sen Median方法又称为Sen斜率估计,是一种稳健的非参数统计的趋势计算方法。它通过考虑数据集中所有可能的点对,计算这些点对之间的斜率,并选择这些斜率的中位数来获取整体趋势的稳健估计。Theil-Sen方法提供了一种对数据趋势的鲁棒估计。与传统的最小二乘法相比,这使得Theil-Sen方法对于异常值或离群值更为鲁棒。Theil-Sen方法是确定性的,这意味着对于给定的数据集,它总是会产生相同的结果。这有助于提高算法的可复制性和稳定性。该方法在处理时间序列分析、环境科学、金融等领域中被广泛使用。在这些领域,数据经常受到噪声、离群值或其他异常情况的影响,而Theil-Sen方法的鲁棒性使其成为一种有价值的工具,该方法计算效率高,对于测量误差和利群数据不敏感,适用于长时间序列数据的趋势分析。 2、Mann-Kendall(MK)检验是一种非参数的时间序列趋势性检验方法,与一些需要数据满足正态分布假设的方法不同,其适用于各种类型的数据分布,不需要测量值服从正太分布,Mann-Kendall方法对于数据中的离群值相对稳健,且不受缺失值和异常值的影响,适用于长时间序列数据的趋势显著检验。
在遥感图像处理中,经常会将这两种方法进行结合来分析总体的变化趋势及其显著性。比如:对下面22年的rsei影像进行分析。 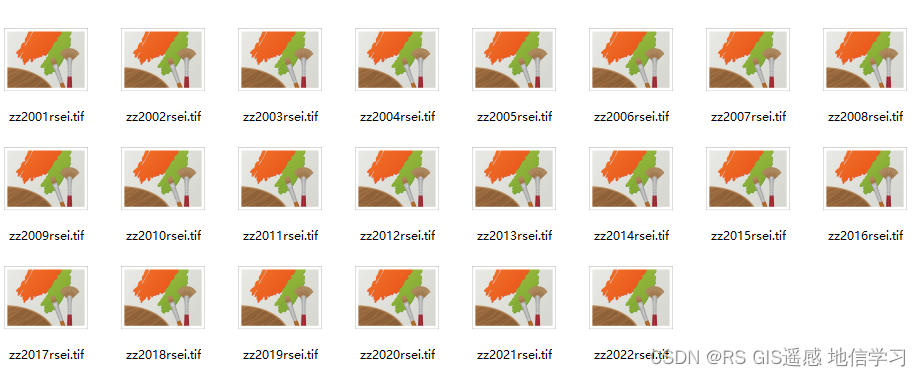 话不多说,直接上代码,有基础的可以用代码进行运算调试,没有基础的可以下载exe文件去计算,链接放下面。 话不多说,直接上代码,有基础的可以用代码进行运算调试,没有基础的可以下载exe文件去计算,链接放下面。
import numpy as np
import pymannkendall as mk
import os
from osgeo import gdal
def write(file_name, image, projection,geotransform,x_size,y_size):
dtype = gdal.GDT_Float32
# 数据格式
driver = gdal.GetDriverByName('GTIFF')
# 创建数据,设置文件路径及名称
new_ds = driver.Create(file_name, x_size, y_size, 1, dtype)
# 设置投影信息及6参数
new_ds.SetGeoTransform(geotransform)
new_ds.SetProjection(projection)
# 将值写入new_ds中
new_ds.GetRasterBand(1).WriteArray(image)
# 把缓存数据写入磁盘
new_ds.FlushCache()
del new_ds
def sen_mk_test(path1, result_path):
# image_path:影像的存储路径
# outputPath:结果输出路径
filepaths = []
for file in os.listdir(path1):
filepath1 = os.path.join(path1, file)
filepaths.append(filepath1)
# 获取影像数量
num_images = len(filepaths)
# 读取影像数据
img1 = gdal.Open(filepaths[0])
# 获取影像的投影,高度和宽度
transform1 = img1.GetGeoTransform()
proj = img1.GetProjection()
height1 = img1.RasterYSize
width1 = img1.RasterXSize
array1 = img1.ReadAsArray(0, 0, width1, height1)
del img1
# 读取所有影像
for path1 in filepaths[1:]:
if path1[-3:] == 'tif':
# print(path1)
img2 = gdal.Open(path1)
array2 = img2.ReadAsArray(0, 0, width1, height1)
array1 = np.vstack((array1, array2))
del img2
#将数组变为三维数组
array1 = array1.reshape((num_images, height1, width1))
# nums, width, height = array1.shape
# 输出矩阵,无值区用nan填充
slope_array = np.full([height1, width1], np.nan)
z_array = np.full([height1, width1], np.nan)
Trend_array = np.full([height1, width1], np.nan)
Tau_array = np.full([height1, width1], np.nan)
s_array = np.full([height1, width1], np.nan)
p_array = np.full([height1, width1], np.nan)
# 只有有值的区域才进行mk检验
c1 = np.isnan(array1)
sum_array1 = np.sum(c1, axis=0)
# nan_positions = np.where(sum_array1 == num_images)
positions = np.where(sum_array1 |