深入理解 Pandas 中的 groupby 函数 |
您所在的位置:网站首页 › groupby方法可用于拆分数据 › 深入理解 Pandas 中的 groupby 函数 |
深入理解 Pandas 中的 groupby 函数
|
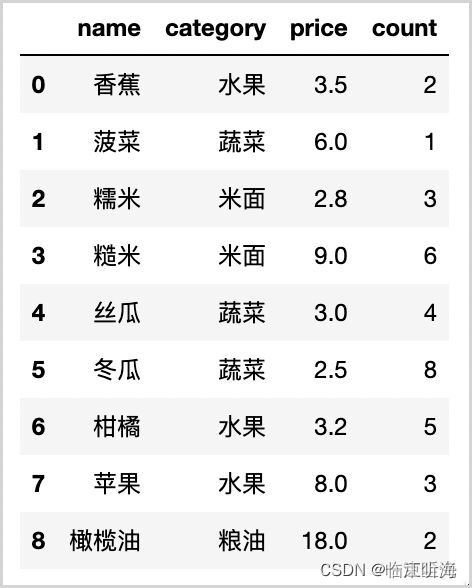
groupby 函数是 pandas 库中 DataFrame 和 Series 对象的一个方法,它允许你对这些对象中的数据进行分组和聚合。下面是 groupby 函数的一些常用语法和用法。 对于 DataFrame 对象,groupby 函数的语法如下: DataFrame.groupby(by=None, axis=0, level=None, as_index=True, sort=True, group_keys=True, squeeze=False, observed=False, dropna=True)其中,各个参数的含义如下: by:用于分组的列名或函数。可以是一个列名、一个函数、一个列表或一个字典。axis:分组轴。如果 axis=0(默认值),则沿着行方向分组;如果 axis=1,则沿着列方向分组。level:在多层索引的情况下,用于指定分组的级别。as_index:是否将分组键作为索引返回。如果 as_index=True(默认值),则返回一个带有分组键作为索引的对象;否则返回一个不带索引的对象。sort:是否对分组键进行排序。如果 sort=True(默认值),则对分组键进行排序;否则不排序。group_keys:是否在结果中包含分组键。如果 group_keys=True(默认值),则在结果中包含分组键;否则不包含。squeeze:是否压缩返回结果。如果 squeeze=True,则尝试压缩返回结果;否则不压缩。observed:是否仅使用观察到的类别进行分组。仅适用于类别类型数据。dropna:是否删除包含缺失值的行。如果 dropna=True(默认值),则删除包含缺失值的行;否则保留。在数据分析中,我们经常需要对数据进行分组和聚合。例如,我们可能需要计算每个类别中某个变量的平均值、最大值或最小值;或者我们需要对每个类别中的数据进行汇总、统计等操作。在这些情况下,groupby 函数就能派上用场。 例如,假设我们有一个 DataFrame 对象,其中包含了若干个数值列和一个类别列: import pandas as pd data = { 'A': [1, 2, 3, 4], 'B': [5, 6, 7, 8], 'C': ['X', 'X', 'Y', 'Y'] } df = pd.DataFrame(data)现在,我们想要计算每个类别中 A 列的平均值。我们可以使用 groupby 函数来实现这一点: result = df.groupby('C')['A'].mean() print(result)当我们运行这段代码时,会看到以下输出: C X 1.5 Y 3.5 Name: A, dtype: float64这表明 groupby 函数已经成功地计算了每个类别中 A 列的平均值。 除了计算平均值之外,我们还可以使用 groupby 函数来执行其他操作。例如,我们可以使用它来计算每个类别中 B 列的最大值: result = df.groupby('C')['B'].max() print(result)当我们运行这段代码时,会看到以下输出: C X 6 Y 8 Name: B, dtype: int64这表明 groupby 函数已经成功地计算了每个类别中 B 列的最大值。 此外,我们还可以使用 groupby 函数来对数据进行汇总和统计。例如,假设我们想要对每个类别中 A 和 B 列的数据进行汇总,我们可以使用以下代码: result = df.groupby('C').agg({'A': 'sum', 'B': 'sum'}) print(result)当我们运行这段代码时,会看到以下输出: A B C X 3 11 Y 7 15这表明 groupby 函数已经成功地对每个类别中 A 和 B 列的数据进行了汇总。 如果想要对重复行进行汇聚,并用分号隔开,你可以使用 groupby 函数和 agg 函数来实现这一点。例如,假设我们有一个 DataFrame 对象,其中包含了若干个数值列和一个类别列: import pandas as pd data = { 'A': ['X', 'X', 'Y', 'Y'], 'B': [1, 2, 3, 4], 'C': ['M', 'N', 'M', 'N'] } df = pd.DataFrame(data)现在,我们想要对 A 列进行分组,并将每组中 C 列的值用分号隔开。我们可以使用 groupby 函数和 agg 函数来实现这一点: result = df.groupby('A').agg({'C': lambda x: ';'.join(x)}) print(result)当我们运行这段代码时,会看到以下输出: C A X M;N Y M;N这表明 groupby 函数和 agg 函数已经成功地对 A 列进行了分组,并将每组中 C 列的值用分号隔开。 总之,groupby 函数是一个非常强大的工具,它允许你快速地对 DataFrame 或 Series 对象中的数据进行分组和聚合。无论你是需要计算统计量,还是需要对数据进行汇总或统计,都可以使用 groupby 函数来完成。 -------------------------------------------------------------------- 一、基本用法先初始化一些数据,方便演示 import pandas as pd df = pd.DataFrame({ 'name': ['香蕉', '菠菜', '糯米', '糙米', '丝瓜', '冬瓜', '柑橘', '苹果', '橄榄油'], 'category': ['水果', '蔬菜', '米面', '米面', '蔬菜', '蔬菜', '水果', '水果', '粮油'], 'price': [3.5, 6, 2.8, 9, 3, 2.5, 3.2, 8, 18], 'count': [2, 1, 3, 6, 4, 8, 5, 3, 2] })
按category分组: grouped = df.groupby('category') print(type(grouped)) print(grouped) 输出结果:
grouped的类型是DataFrameGroupBy,直接尝试输出,打印是内存地址,不太直观,这里写一个函数来展示(可以这么写的原理,后面会介绍) def view_group(the_pd_group): for name, group in the_pd_group: print(f'group name: {name}') print('-' * 30) print(group) print('=' * 30, '\n') view_group(grouped) 输出结果 group name: 水果 ------------------------------ name category price count 0 香蕉 水果 3.5 2 6 柑橘 水果 3.2 5 7 苹果 水果 8.0 3 ============================== group name: 米面 ------------------------------ name category price count 2 糯米 米面 2.8 3 3 糙米 米面 9.0 6 ============================== group name: 粮油 ------------------------------ name category price count 8 橄榄油 粮油 18.0 2 ============================== group name: 蔬菜 ------------------------------ name category price count 1 菠菜 蔬菜 6.0 1 4 丝瓜 蔬菜 3.0 4 5 冬瓜 蔬菜 2.5 8 ============================== 二、参数源码探析接下来看一下源码中的方法定义 DataFrame的groupby: def groupby( self, by=None, axis: Axis = 0, level: Level | None = None, as_index: bool = True, sort: bool = True, group_keys: bool = True, squeeze: bool | lib.NoDefault = no_default, observed: bool = False, dropna: bool = True, ) -> DataFrameGroupBy: pass Series的groupby: def groupby( self, by=None, axis=0, level=None, as_index: bool = True, sort: bool = True, group_keys: bool = True, squeeze: bool | lib.NoDefault = no_default, observed: bool = False, dropna: bool = True, ) -> SeriesGroupBy: pass Series的groupby函数操作与DataFrame类似,这篇文章只以DataFrame作为示例 入参 by再来回忆一下基本用法里的写法: grouped = df.groupby('category') 这里传入的category就是第1个参数by,表示要按照什么进行分组,根据官方文档介绍,by可以是mapping, function, label, list of labels中的一种,这里是用的label,也就是说,还可以像下面这样写 label列表grouped = df.groupby(['category']) 2.mapping 这种方式需要按DataFrame的index进行映射,这里把水果和蔬菜划分到大组蔬菜水果,米面和粮油划分到大组米面粮油 category_dict = {'水果': '蔬菜水果', '蔬菜': '蔬菜水果', '米面': '米面粮油', '粮油': '米面粮油'} the_map = {} for i in range(len(df.index)): the_map[i] = category_dict[df.iloc[i]['category']] grouped = df.groupby(the_map) view_group(grouped) 输出结果如下 group name: 米面粮油 ------------------------------ name category price count 2 糯米 米面 2.8 3 3 糙米 米面 9.0 6 8 橄榄油 粮油 18.0 2 ============================== group name: 蔬菜水果 ------------------------------ name category price count 0 香蕉 水果 3.5 2 1 菠菜 蔬菜 6.0 1 4 丝瓜 蔬菜 3.0 4 5 冬瓜 蔬菜 2.5 8 6 柑橘 水果 3.2 5 7 苹果 水果 8.0 3 ============================== 3.function 这种方式下,自定义函数的入参也是DataFrame的index,输出结果与mapping的例子相同 category_dict = {'水果': '蔬菜水果', '蔬菜': '蔬菜水果', '米面': '米面粮油', '粮油': '米面粮油'} def to_big_category(the_idx): return category_dict[df.iloc[the_idx]['category']] grouped = df.groupby(to_big_category) view_group(grouped) axisaxis表示以哪个轴作为分组的切分依据 0 - 等价于index, 表示按行切分,默认 1 - 等价于columns,表示按列切分 这里看一下按列切分的示例 def group_columns(column_name: str): if column_name in ['name', 'category']: return 'Group 1' else: return 'Group 2' # 等价写法 grouped = df.head(3).groupby(group_columns, axis='columns') grouped = df.head(3).groupby(group_columns, axis=1) view_group(grouped) 输出结果如下: group name: Group 1 ------------------------------ name category 0 香蕉 水果 1 菠菜 蔬菜 2 糯米 米面 ============================== group name: Group 2 ------------------------------ price count 0 3.5 2 1 6.0 1 2 2.8 3 ============================== 相当于把表从垂直方向上切开,左半部分为Group 1,右半部分为Group 2 level 当axis是MultiIndex(层级结构)时,按特定的level进行分组,注意这里的level是int类型,从0开始,0表示第1层,以此类推 构造另一组带MultiIndex的测试数据 the_arrays = [['A', 'A', 'A', 'B', 'A', 'A', 'A', 'B', 'A', 'A'], ['蔬菜水果', '蔬菜水果', '米面粮油', '休闲食品', '米面粮油', '蔬菜水果', '蔬菜水果', '休闲食品', '蔬菜水果', '米面粮油'], ['水果', '蔬菜', '米面', '糖果', '米面', '蔬菜', '蔬菜', '饼干', '水果', '粮油']] the_index = pd.MultiIndex.from_arrays(arrays=the_arrays, names=['one ', 'two', 'three']) df_2 = pd.DataFrame(data=[3.5, 6, 2.8, 4, 9, 3, 2.5, 3.2, 8, 18], index=the_index, columns=['price']) print(df_2) 输出结果如下: price one two three A 蔬菜水果 水果 3.5 蔬菜 6.0 米面粮油 米面 2.8 B 休闲食品 糖果 4.0 A 米面粮油 米面 9.0 蔬菜水果 蔬菜 3.0 蔬菜 2.5 B 休闲食品 饼干 3.2 A 蔬菜水果 水果 8.0 米面粮油 粮油 18.01. 按第3层分组 grouped = df_2.groupby(level=2) view_group(grouped) 输出结果如下: group name: 水果 ------------------------------ price one two three A 蔬菜水果 水果 3.5 水果 8.0 ============================== group name: 米面 ------------------------------ price one two three A 米面粮油 米面 2.8 米面 9.0 ============================== group name: 粮油 ------------------------------ price one two three A 米面粮油 粮油 18.0 ============================== group name: 糖果 ------------------------------ price one two three B 休闲食品 糖果 4.0 ============================== group name: 蔬菜 ------------------------------ price one two three A 蔬菜水果 蔬菜 6.0 蔬菜 3.0 蔬菜 2.5 ============================== group name: 饼干 ------------------------------ price one two three B 休闲食品 饼干 3.2 ============================== 共6个分组 2. 按第1, 2层分组 grouped = df_2.groupby(level=[0, 1]) view_group(grouped) 输出结果如下: group name: ('A', '米面粮油') ------------------------------ price one two three A 米面粮油 米面 2.8 米面 9.0 粮油 18.0 ============================== group name: ('A', '蔬菜水果') ------------------------------ price one two three A 蔬菜水果 水果 3.5 蔬菜 6.0 蔬菜 3.0 蔬菜 2.5 水果 8.0 ============================== group name: ('B', '休闲食品') ------------------------------ price one two three B 休闲食品 糖果 4.0 饼干 3.2 ============================== 共3个分组,可以看到,分组名称变成了元组 as_indexbool类型,默认值为True。对于聚合输出,返回对象以分组名作为索引 grouped = self.df.groupby('category', as_index=True) print(grouped.sum()) as_index为 True 的输出结果如下: price count category 水果 14.7 10 米面 11.8 9 粮油 18.0 2 蔬菜 11.5 13 grouped = self.df.groupby('category', as_index=False) print(grouped.sum()) as_index为 False 的输出结果如下,与SQL的groupby输出风格相似 category price count 0 水果 14.7 10 1 米面 11.8 9 2 粮油 18.0 2 3 蔬菜 11.5 13 sort bool类型,默认为True。是否对分组名进行排序,关闭自动排序可以提高性能。注意:对分组名排序并不影响分组内的顺序 group_keys bool类型,默认为True 如果为True,调用apply时,将分组的keys添加到索引中 squeeze 1.1.0版本已废弃,不解释 observed bool类型,默认值为False 仅适用于任何 groupers 是分类(Categoricals)的 如果为 True,仅显示分类分组的观察值; 如果为 False ,显示分类分组的所有值 dropna bool类型,默认值为True,1.1.0版本新增参数 如果为 True,且分组的keys中包含NA值,则 NA 值连同行(axis=0)/列(axis=1)将被删除 如果为 False,NA值也被视为分组的keys,不做处理 返回值 DateFrame的gropuby函数,返回类型是DataFrameGroupBy,而Series的groupby函数,返回类型是SeriesGroupBy |
【本文地址】
今日新闻 |
推荐新闻 |