一文读懂结果输出命令大全(上) |
您所在的位置:网站首页 › esttab和outreg2 › 一文读懂结果输出命令大全(上) |
一文读懂结果输出命令大全(上)
|
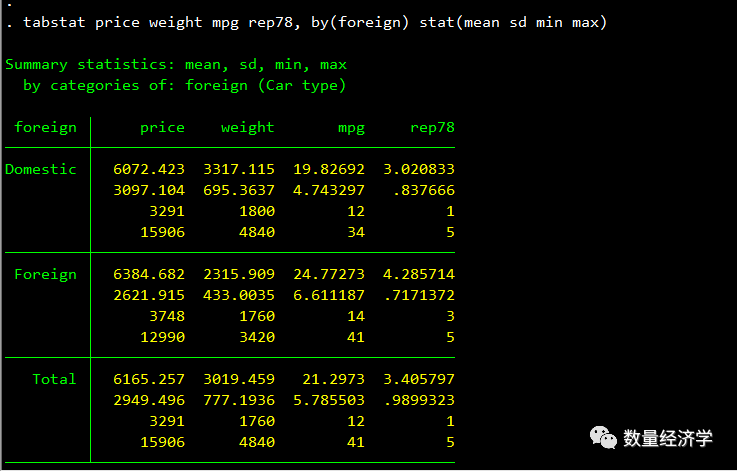
sd,标准差 variance,方差 semean,即sd/√n skewness,偏度 kurtosis,峰度 p1,第一分位数 p5,第五分位数 p10,第十分位数 p50,中位数 median,中位数 range,max-min 示例: tabstat price weight mpg rep78, by(foreign) stat(mean sd min max)对变量price, weight, mpg, and rep78 按照foreign分类展示其描述统计量mean sd min max 结果为:
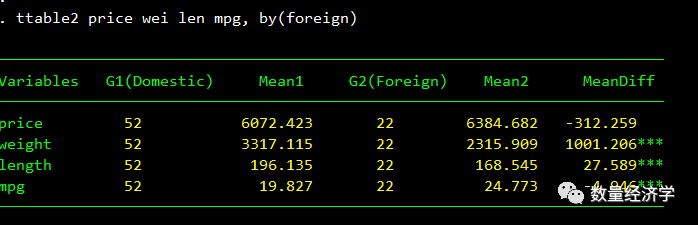
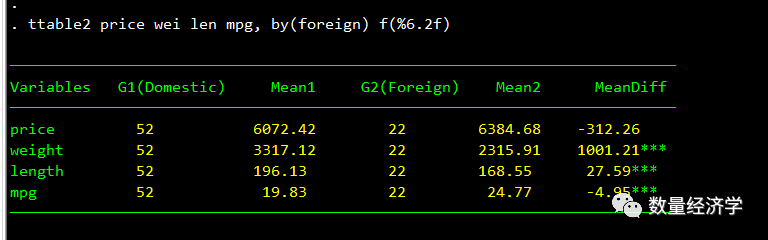
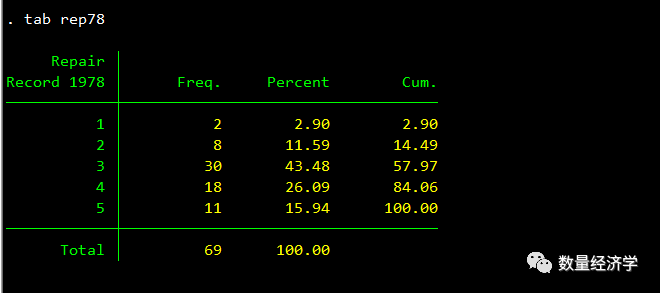
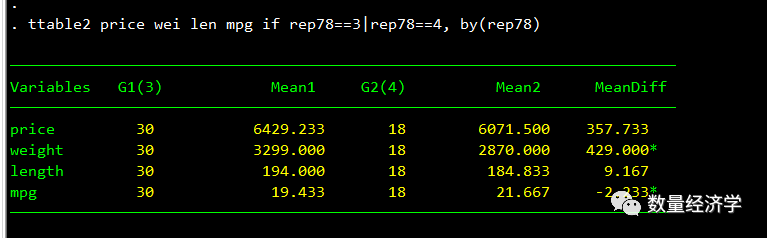
2、ttest 样本检验 示例: webusefuel3 (setup) ttestmpg, by(treated) (two-sample t test using groups) webusefuel (setup) ttestmpg1==mpg2 (two-sample t test using variables) 3、ttable2 示例: tabrep78 ttable2price wei len mpg if rep78==3|rep78==4, by(rep78) **输出保存到 Word文档等Save in Excel or Word logout, save(Tab2_corr) excel replace: ttable2 price wei len mpg, by(foreign) 结果为:
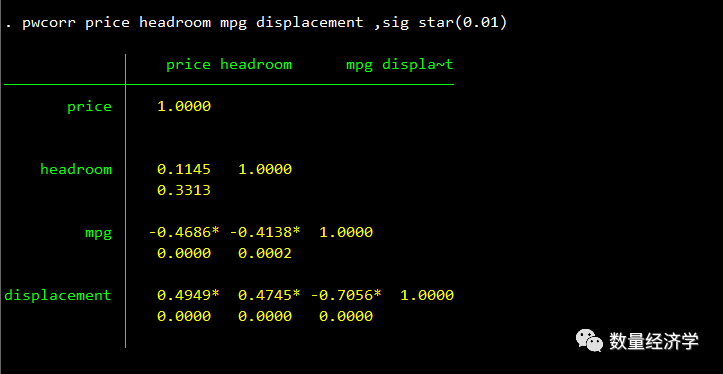
4、pwcorr VS pwcorr_a 相关系数的命令一般有corr、pwcorr,但是pwcorr的一个缺点是只能一次输出一个置信水平下的显著性,因此本文将为大家介绍pwcorr_a的具体使用。 1 命令回顾 correlate -- Correlations of variables进行变量相关系数的命令,该命令主要分为corr以及pwcorr 语法格式为: 案例1: 结果为:
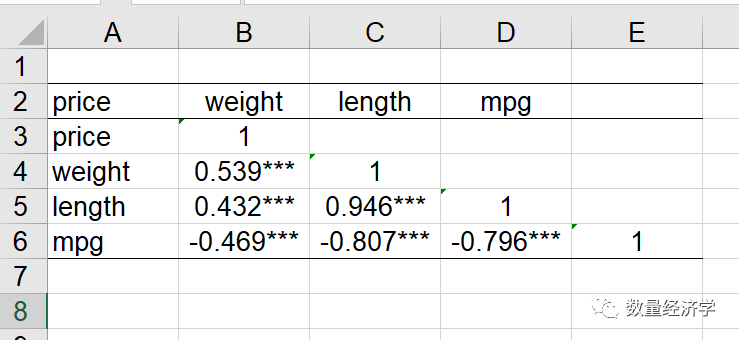
使用pwcorr可以对指定的显著性水平进行标注。缺点是只能对指定的显著水平标注一个 *,即无法同时标注1% 5% 10%。 2 pwcorr_a pwcorr_a 可以对1%,5%,10% 的显著水平进行标注 *** ,** 和 * 语法格式为: 主要选项含义为: star1(#) :1% significance level for displaying with three stars, newly added 新增的标注1%水平下三颗星 star5(#) 5% significance level for displaying with two stars, newly added 新增的标注5%水平下两颗星 star10(#) 10% significance level for displaying with one star, newly added 新增的标注10%水平下一颗星 案例应用介绍 结果为: 3 输出相关系数矩阵到Word文档中 代码为: 结果为: 4 输出相关系数矩阵到Excel文档中 代码为: 结果为:
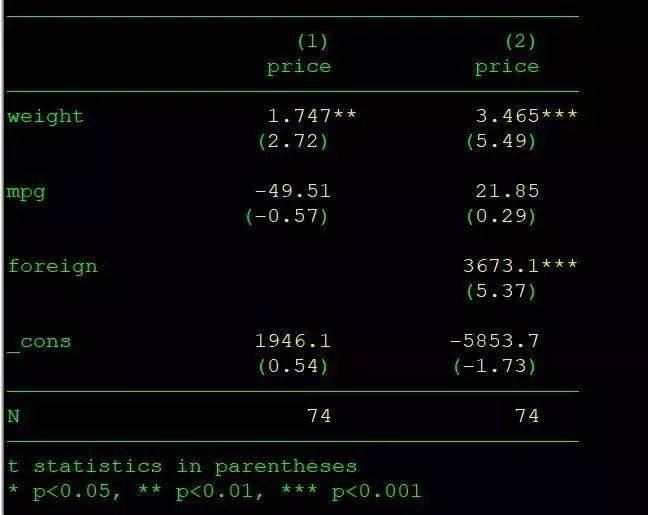
5、esttab 新的esttab命令是estout的升级版本。它的语法相比较于estout而言,默认情况下,它会生成很好地结果,并输出在Stata的结果窗口中。 esttab不仅仅是estout的简化版本。另一方面,esttab提供完整的estout功能,因为所有的estout选项都是允许在esttab中。另一方面,esttab也扩展了功能。例如,esttab支持与WORD、Excel、Latex、Html结果 一、Basic syntax and usage Syntax esttab [namelist] [using filename] [, options] 与estout(或官方Stata的估计表)一样,基本程序是首先存储多个模型,然后将esttab应用于这些存储的估计集以组成回归表。但是,esttab和estout之间的主要区别在于,如果在没有选项的情况下应用,esttab会生成一个完全格式化的表。
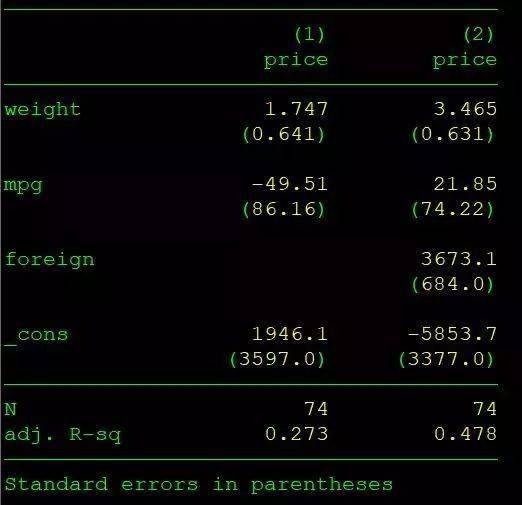
二、添加统计量 The default in esttab is to display raw point estimates along with t statistics and to print the number of observations in the table footer. Furthermore, the output displays asterisks denoting the statistical significance of coefficients. All this can be changed. To replace the t statistics with standard errors, add the adjusted R-squared, and omit the significance asterisks; for example, type esttab, se ar2 nostar 结果为:
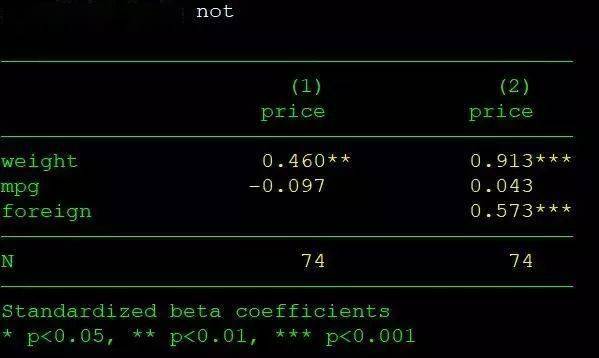
t统计量也可以用p值(p),置信区间(ci)或 估计中包含的任何参数统计信息(请参阅aux选项)。更多信息请参考esttab的option选项。 esttab, beta not
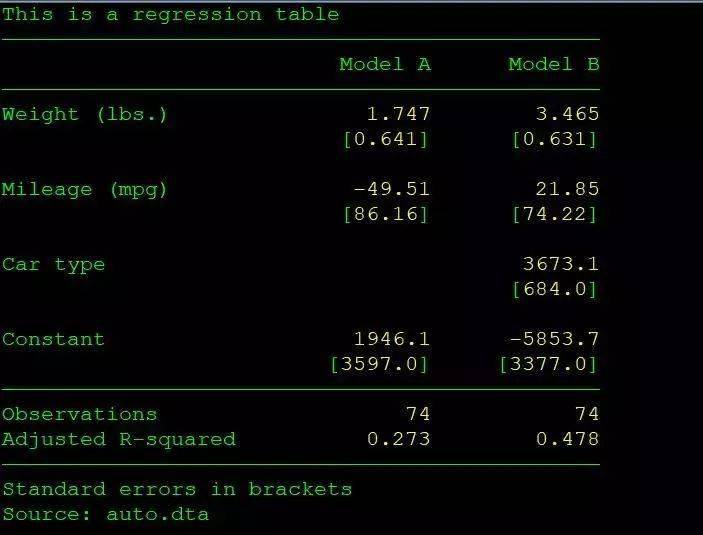
三、添加数据来源以及表头等信息 Furthermore, the plain option produces a minimally formatted table with all display formats set to Stata’s %9.0g quasistandard, and compress reduces horizontal spacing to fit more models on screen without line breaking. Other options are, for example, label, which causes variable labels to be used, and mtitles, which specifies that model titles be printed in the header above the model columns. For example, esttab, se ar2 nostar brackets label title(This is a regression table) > nonumbers mtitles("Model A" "Model B") addnote("Source: auto.dta")
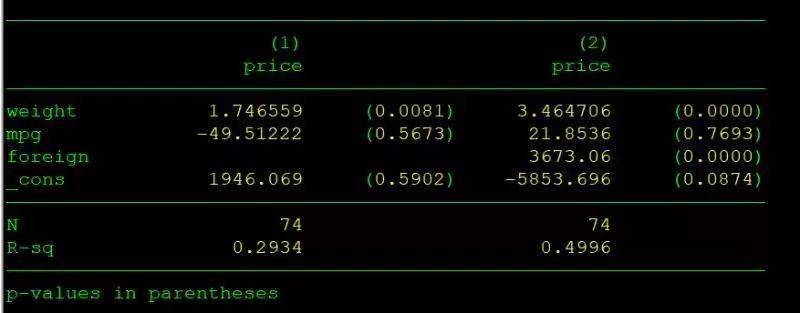
四、数据结果小数点位数保存格式 esttab, b(%9.0g) p(4) r2(4) nostar wide
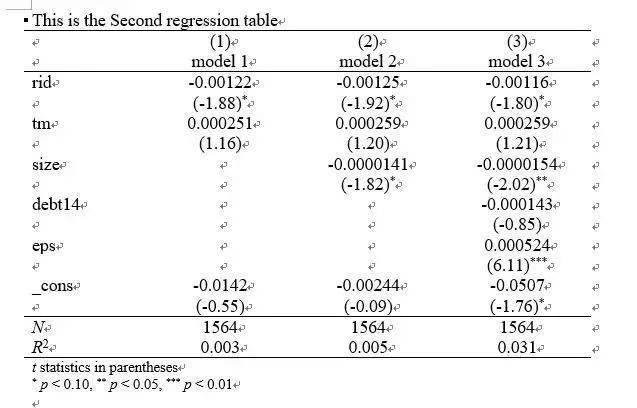
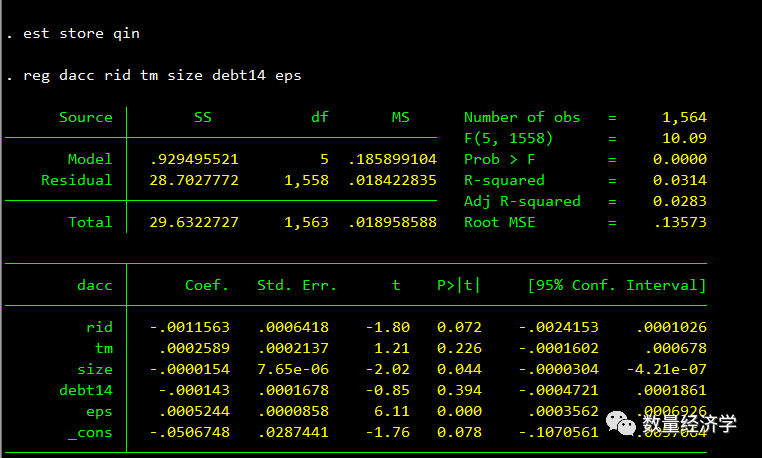
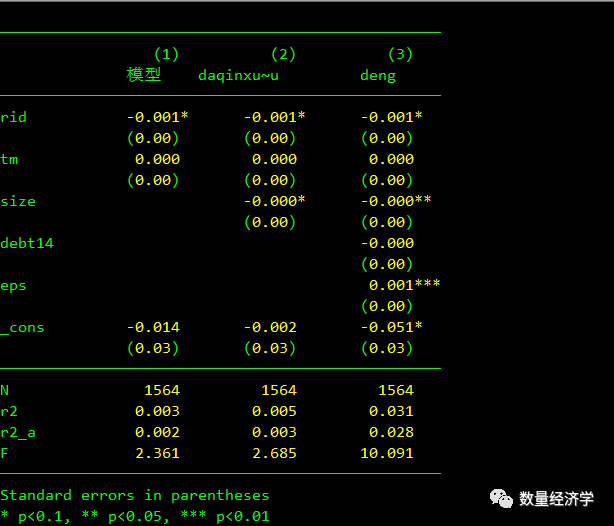
五、结果输出 use "E:\stata\data\盈余管理新版.dta", clear reg dacc rid tm est store da reg dacc rid tm size est store qin reg dacc rid tm size debt14 eps est store daqinxueshu esttab da qin daqinxueshu using daqinxueshu14.rtf, /// mtitles("model 1" "model 2" "model 3" ) /// title("This is the Second regression table") /// append star( * 0.10 ** 0.05 *** 0.01 ) staraux r2 nogaps
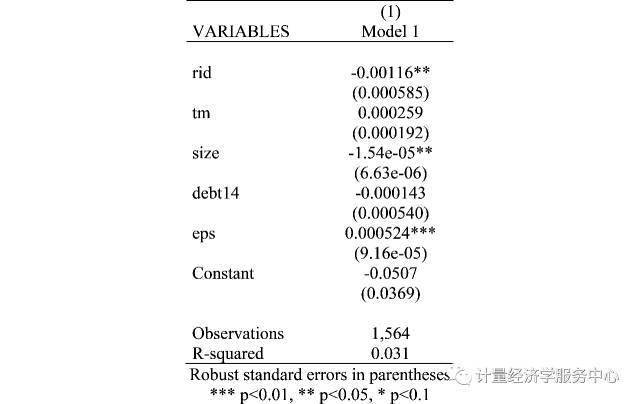
6、outreg2 命令outreg2可以帮助你在学术论文中看到的展示类型。注意到这一点很重要,它不是一个Stata命令,它是一个用户编写的过程,您需要通过输入来安装它(只有第一次)。 ssc install outreg2 Example1: stata code: cd E:\stata\results use "E:\stata\data\盈余管理新版.dta", clear reg dacc rid tm size debt14 eps, robust outreg2 using 计量经济学服务中心.doc, replace ctitle(Model 1) 结果输出为:
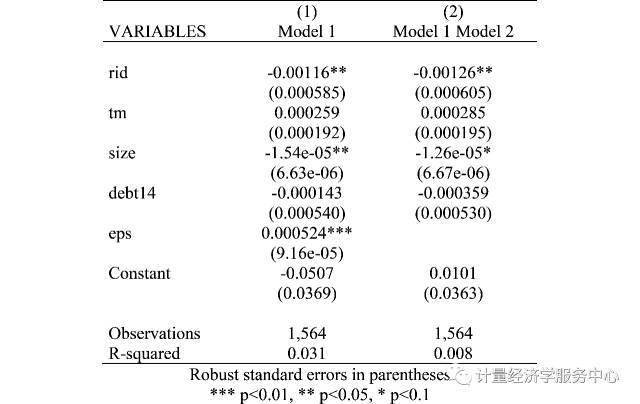
You can add other model (using variable x2) by using the option append Example2: stata code: use "E:\stata\data\盈余管理新版.dta", clear reg dacc rid tm size debt14 , robust outreg2 using 计量经济学服务中心.doc, append ctitle(Model 1 Model 2) 结果输出为:
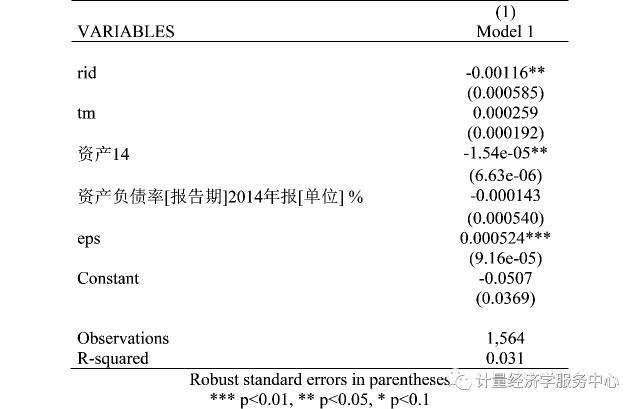
Showing variable labels The command outreg2 gives you the type of presentation you see in academic papers. It is important to notice that outreg2 is not a Stata command, it is a user-written procedure, and you need to install it by typing (only the first time) Example3: stata code: use "E:\stata\data\盈余管理新版.dta", clear reg dacc rid tm size debt14 , robust outreg2 using 计量经济学服务中心.doc, replace ctitle(Model 1) label 结果输出为:
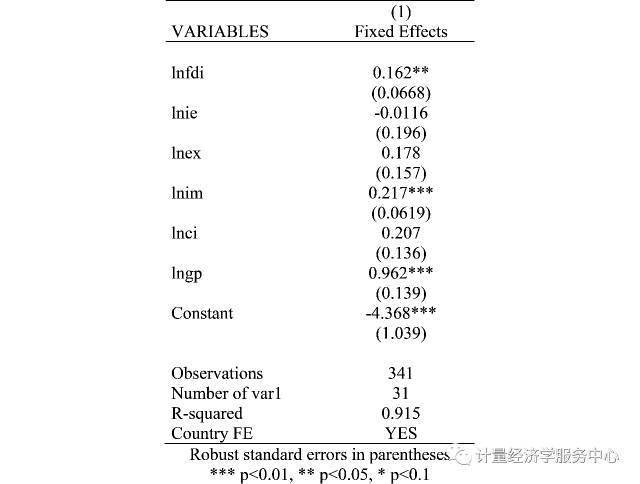
Fixed effects regression Example4: stata code: use "E:\stata\data\FDI.dta", clear xtreg lngdp lnfdi lnie lnex lnim lnci lngp,fe robust //固定效应估计 outreg2 using 计量经济学服务中心.doc, replace ctitle(Fixed Effects) addtext(Country FE, YES) 结果输出为:
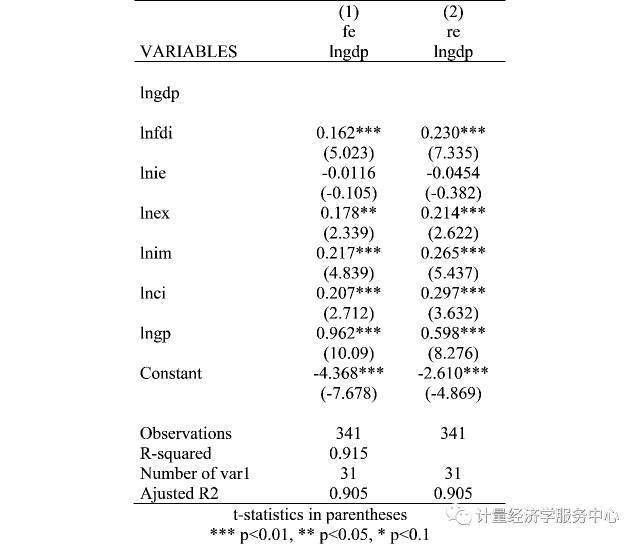
Comparing different linear models Fixed effects with time fixed effects Example5: stata code: use "E:\stata\data\FDI.dta", clear xtreg lngdp lnfdi lnie lnex lnim lnci lngp,re est store re xtreg lngdp lnfdi lnie lnex lnim lnci lngp,fe est store fe hausman fe re est table re fe, b(%6.3f) star(0.1 0.05 0.01) outreg2 [fe re] using daqinxueshu.doc,stats(coef,tstat) addstat(Ajusted R2,`e(r2_a)') replace 结果输出为:
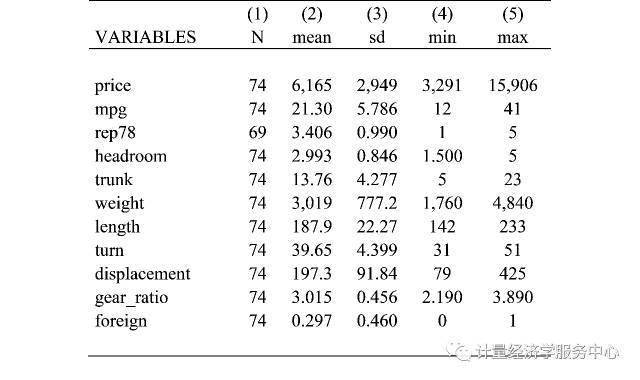
Summary statistics Using outreg2 for summary statistics: all variables in dataset Example6: stata code: cd E:\stata\results sysuse auto, clear outreg2 using 计量经济学服务中心.doc, replace sum(log)
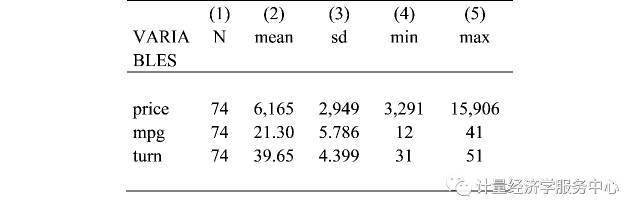
Using outreg2 for summary statistics: selected variables stata code: cd E:\stata\results sysuse auto, clear outreg2 using 计量经济学服务中心.doc, replace sum(log) keep(price mpg turn)
Using outreg2 for summary statistics: selected variables in dataset and selected statistics stata code: sysuse auto, clear outreg2 using 计量经济学服务中心.doc, replace sum(log) keep(price mpg turn) eqkeep(N mean)
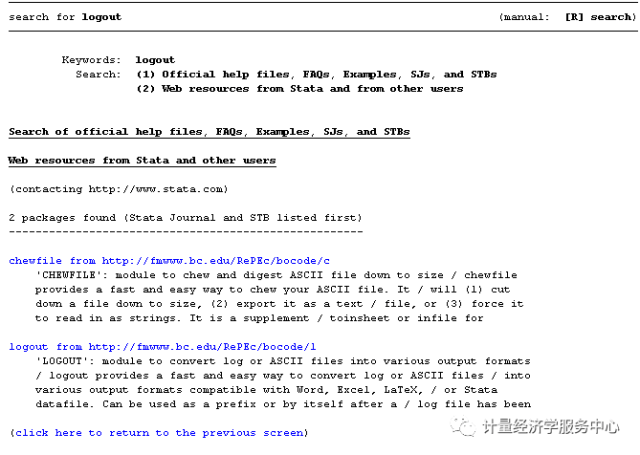
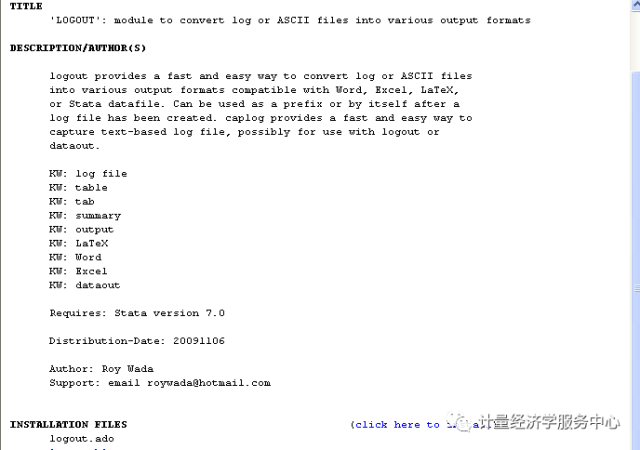
Using outreg2 for summary statistics: selected variables in dataset and detail statistics stata code: sysuse auto, clear set more off outreg2 using 计量经济学服务中心.doc, replace sum(detail) keep(price mpg turn) 7、logout 本文为大家介绍命令如下: ssc install logout 方法1安装外部命令,另外一种方法为:findit logout
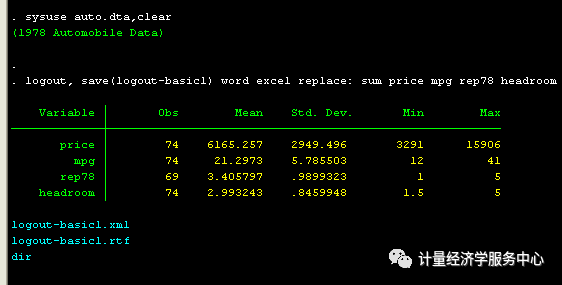
描述性分析- 描述性统计通常对收集来的数据进行直接的频率、频数等描述,描述性统计分析一般对样本的最小值、最大值、平均值、标准偏差等进行分析,这些数据有助于了解样本数据特征,能够清晰的看到各个统计量的分布情况。 程序如下: sysuse auto.dta,clear logout, save(logout-basic1) word excel replace: sum price mpg rep78 headroom 输出结果如下:
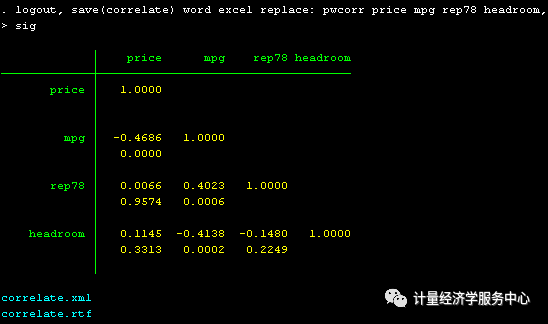
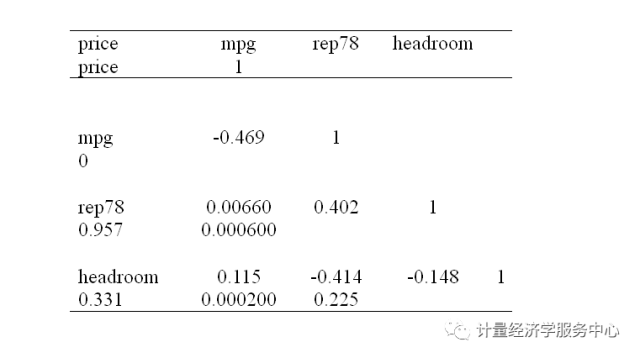
相关分析- 相关关系中的重要方法——相关分析,可以研究变量之间关联程度和密切程度,而变量之间的关联程度可以用相关系数表示。 logout, save(correlate) word excel replace: pwcorr price mpg rep78 headroom, sig
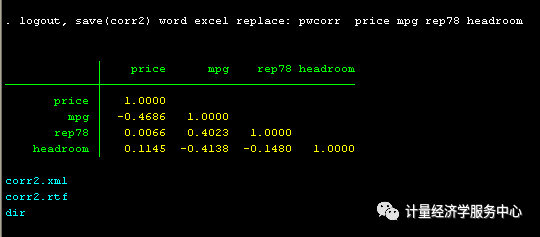
logout,save(corr2) word excel replace: pwcorr price mpg rep78 headroom
回归分析结果 结果为:
|

 返回搜狐,查看更多
【本文地址】