|
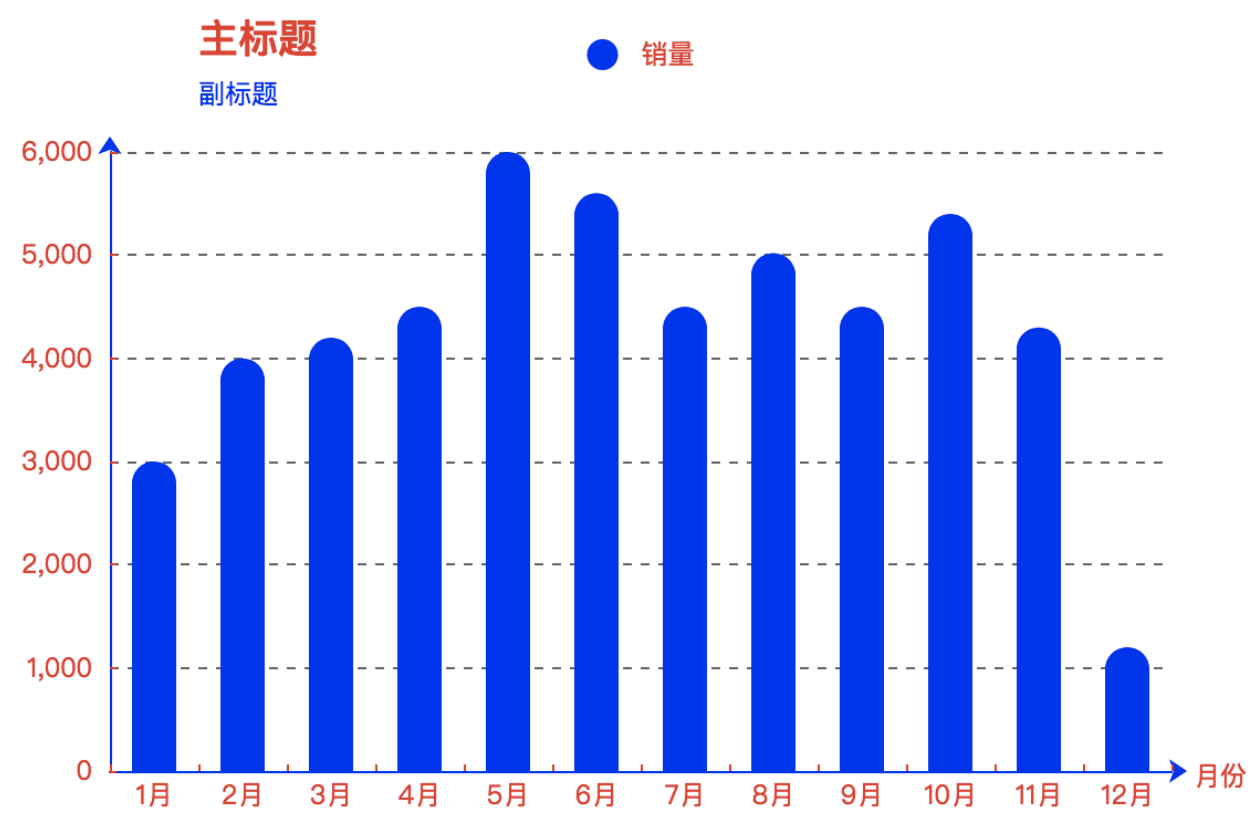
1、基本柱状图
// 指定图表的配置项和数据
var option = {
// ---- 标题 -----
title: {
text: '主标题',
textStyle: {
color: 'red'
},
subtext: '副标题',
subtextStyle: {
color: 'blue'
},
padding: [0, 0, 10, 100] // 位置
},
// ---- legend ----
legend: {
type: 'plain', // 图列类型,默认为 'plain'
top: '1%', // 图列相对容器的位置 top\bottom\left\right
selected: {
// '销量': true // 图列选择,图形加载出来会显示选择的图列,默认为true
},
textStyle: { // 图列内容样式
color: '#fff', // 字体颜色
backgroundColor: 'black' // 字体背景色
},
tooltip: { // 图列提示框,默认不显示
show: true,
color: 'red'
},
data: [ // 图列内容
{
name: '销量',
icon: 'circle',
textStyle: {
color: 'red', // 单独设置某一个图列的颜色
backgroundColor: '#fff' // 单独设置某一个图列的字体背景色
}
}
]
},
// --- 提示框 ----
tooltip: {
show: true, // 是否显示提示框,默认为true
trigger: 'item', // 数据项图形触发
axisPointer: { // 指示样式
type: 'shadow',
axis: 'auto'
},
padding: 5,
textStyle: { // 提示框内容的样式
color: '#fff'
}
},
// ---- gird区域 ---
gird: {
show: false, // 是否显示直角坐标系网格
top: 80, // 相对位置 top\bottom\left\right
containLabel: false, // gird 区域是否包含坐标轴的刻度标签
tooltip: {
show: true,
trigger: 'item', // 触发类型
textStyle: {
color: '#666'
}
}
},
// ------ X轴 ------
xAxis: {
show: true, // 是否显示
position: 'bottom', // x轴的位置
offset: 0, // x轴相对于默认位置的偏移
type: 'category', // 轴类型, 默认为 'category'
name: '月份', // 轴名称
nameLocation: 'end', // 轴名称相对位置
nameTextStyle: { // 坐标轴名称样式
color: 'red',
padding: [5, 0, 0, -5]
},
nameGap: 15, // 坐标轴名称与轴线之间的距离
nameRotate: 0, // 坐标轴名字旋转
axisLine: { // 坐标轴 轴线
show: true, // 是否显示
symbol: ['none', 'arrow'], // 是否显示轴线箭头
symbolSize: [8, 8], // 箭头大小
symbolOffset: [0, 7], // 箭头位置
// ------ 线 ---------
lineStyle: {
color: 'blue',
width: 1,
type: 'solid'
}
},
axisTick: { // 坐标轴 刻度
show: true, // 是否显示
inside: true, // 是否朝内
length: 3, // 长度
lineStyle: { // 默认取轴线的样式
color: 'red',
width: 1,
type: 'solid'
}
},
axisLabel: { // 坐标轴标签
show: true, // 是否显示
inside: false, // 是否朝内
rotate: 0, // 旋转角度
margin: 5, // 刻度标签与轴线之间的距离
color: 'red' // 默认取轴线的颜色
},
splitLine: { // gird区域中的分割线
show: false, // 是否显示
lineStyle: {
// color: 'red',
// width: 1,
// type: 'solid'
}
},
splitArea: { // 网格区域
show: false // 是否显示,默认为false
},
data: ['1月', '2月', '3月', '4月', '5月', '6月', '7月', '8月', '9月', '10月', '11月', '12月']
},
// ------ y轴 ----------
yAxis: {
show: true, // 是否显示
position: 'left', // y轴位置
offset: 0, // y轴相对于默认位置的偏移
type: 'value', // 轴类型,默认为 ‘category’
name: '销量', // 轴名称
nameLocation: 'end', // 轴名称相对位置value
nameTextStyle: { // 坐标轴名称样式
color: '#fff',
padding: [5, 0, 0, 5] // 坐标轴名称相对位置
},
nameGap: 15, // 坐标轴名称与轴线之间的距离
nameRotate: 270, // 坐标轴名字旋转
axisLine: { // 坐标轴 轴线
show: true, // 是否显示
// ----- 箭头 -----
symbol: ['none', 'arrow'], // 是否显示轴线箭头
symbolSize: [8, 8], // 箭头大小
symbolOffset: [0, 7], // 箭头位置
// ----- 线 -------
lineStyle: {
color: 'blue',
width: 1,
type: 'solid'
}
},
axisTick: { // 坐标轴的刻度
show: true, // 是否显示
inside: true, // 是否朝内
length: 3, // 长度
lineStyle: {
color: 'red', // 默认取轴线的颜色
width: 1,
type: 'solid'
}
},
axisLabel: { // 坐标轴的标签
show: true, // 是否显示
inside: false, // 是否朝内
rotate: 0, // 旋转角度
margin: 8, // 刻度标签与轴线之间的距离
color: 'red', // 默认轴线的颜色
},
splitLine: { // gird 区域中的分割线
show: true, // 是否显示
lineStyle: {
color: '#666',
width: 1,
type: 'dashed'
}
},
splitArea: { // 网格区域
show: false // 是否显示,默认为false
}
},
// ------- 内容数据 -------
series: [
{
name: '销量', // 序列名称
type: 'bar', // 类型
legendHoverLink: true, // 是否启用图列 hover 时的联动高亮
label: { // 图形上的文本标签
show: false,
position: 'insideTop', // 相对位置
rotate: 0, // 旋转角度
color: '#eee'
},
itemStyle: { // 图形的形状
color: 'blue',
barBorderRadius: [18, 18, 0 ,0]
},
barWidth: 20, // 柱形的宽度
barCategoryGap: '20%', // 柱形的间距
data: [3000, 4000, 4200, 4500, 6000, 5600, 4500, 5020, 4500, 5400, 4300, 1200]
}
]
};
html代码
ECharts
// 基于准备好的dom,初始化echarts实例
var myChart = echarts.init(document.getElementById('main'));
// 使用刚指定的配置项和数据显示图表。
myChart.setOption(option);
2、折叠柱状图

// 指定图表的配置项和数据
option = {
title: {
text: "",
textStyle: {
color: "#436EEE",
fontSize: 17
}
},
tooltip: {
trigger: 'axis',
axisPointer: {
type: 'shadow'
}
},
legend: {
data:[
{
name: '政策法规',
icon: 'circle',
textStyle: {
color: 'red', // 单独设置某一个图列的颜色
backgroundColor: '#fff' // 单独设置某一个图列的字体背景色
}
},
{
name: '经办规程',
icon: 'circle',
textStyle: {
color: 'red', // 单独设置某一个图列的颜色
backgroundColor: '#fff' // 单独设置某一个图列的字体背景色
}
},
{
name: '业务场景模拟',
icon: 'circle',
textStyle: {
color: 'red', // 单独设置某一个图列的颜色
backgroundColor: '#fff' // 单独设置某一个图列的字体背景色
}
},
{
name: '常见问题',
icon: 'circle',
textStyle: {
color: 'red', // 单独设置某一个图列的颜色
backgroundColor: '#fff' // 单独设置某一个图列的字体背景色
}
}
]
},
//x轴显示
xAxis: {
data: [20180611, 20180612, 20180613, 20180614, 20180615, 20180616, 20180617],
show: true, // 是否显示
position: 'bottom', // x轴的位置
offset: 0, // x轴相对于默认位置的偏移
type: 'category', // 轴类型, 默认为 'category'
name: '月份', // 轴名称
nameLocation: 'end', // 轴名称相对位置
nameTextStyle: { // 坐标轴名称样式
color: 'red',
padding: [5, 0, 0, -5]
},
nameGap: 15, // 坐标轴名称与轴线之间的距离
nameRotate: 0, // 坐标轴名字旋转
axisLine: { // 坐标轴 轴线
show: true, // 是否显示
symbol: ['none', 'arrow'], // 是否显示轴线箭头
symbolSize: [8, 8], // 箭头大小
symbolOffset: [0, 7], // 箭头位置
// ------ 线 ---------
lineStyle: {
color: 'blue',
width: 1,
type: 'solid'
}
},
axisTick: { // 坐标轴 刻度
show: true, // 是否显示
inside: true, // 是否朝内
length: 3, // 长度
lineStyle: { // 默认取轴线的样式
color: 'red',
width: 1,
type: 'solid'
}
},
axisLabel: { // 坐标轴标签
show: true, // 是否显示
inside: false, // 是否朝内
rotate: 0, // 旋转角度
margin: 5, // 刻度标签与轴线之间的距离
color: 'red' // 默认取轴线的颜色
},
splitLine: { // gird区域中的分割线
show: false, // 是否显示
lineStyle: {
// color: 'red',
// width: 1,
// type: 'solid'
}
},
splitArea: { // 网格区域
show: false // 是否显示,默认为false
},
// show: false
},
// ------ y轴 ----------
yAxis: {
show: true, // 是否显示
position: 'left', // y轴位置
offset: 0, // y轴相对于默认位置的偏移
type: 'value', // 轴类型,默认为 ‘category’
name: '销量', // 轴名称
nameLocation: 'end', // 轴名称相对位置value
nameTextStyle: { // 坐标轴名称样式
color: '#fff',
padding: [5, 0, 0, 5] // 坐标轴名称相对位置
},
nameGap: 15, // 坐标轴名称与轴线之间的距离
nameRotate: 270, // 坐标轴名字旋转
axisLine: { // 坐标轴 轴线
show: true, // 是否显示
// ----- 箭头 -----
symbol: ['none', 'arrow'], // 是否显示轴线箭头
symbolSize: [8, 8], // 箭头大小
symbolOffset: [0, 7], // 箭头位置
// ----- 线 -------
lineStyle: {
color: 'blue',
width: 1,
type: 'solid'
}
},
axisTick: { // 坐标轴的刻度
show: true, // 是否显示
inside: true, // 是否朝内
length: 3, // 长度
lineStyle: {
color: 'red', // 默认取轴线的颜色
width: 1,
type: 'solid'
}
},
axisLabel: { // 坐标轴的标签
show: true, // 是否显示
inside: false, // 是否朝内
rotate: 0, // 旋转角度
margin: 8, // 刻度标签与轴线之间的距离
color: 'red', // 默认轴线的颜色
},
splitLine: { // gird 区域中的分割线
show: true, // 是否显示
lineStyle: {
color: '#666',
width: 1,
type: 'dashed'
}
},
splitArea: { // 网格区域
show: false // 是否显示,默认为false
}
},
tooltip: {
position: ['50%', '50%'],
padding: [5, 10]
},
grid: {
left: '0%'
},
series: [
{
name: "政策法规",
type: "bar",
stack: "业务",//折叠显示
data: ["87.54", "88.54", "90", "91", "92", '95', '100'],
barWidth : 25,
//显示颜色
itemStyle:{
normal:{color:"blue"}
},
label: { // 图形上的文本标签
show: false,
position: 'insideTop', // 相对位置
rotate: 0, // 旋转角度
color: '#eee'
}
},
{
name: "经办规程",
type: "bar",
stack: "业务",
data: ["87.54", "88.54", "90", "91", "92", '95', '100'],
barWidth : 25,
label: { // 图形上的文本标签
show: false,
position: 'insideTop', // 相对位置
rotate: 0, // 旋转角度
color: '#eee'
},
itemStyle:{
normal:{color:"#FF8849"}
}
},
{
name: "业务场景模拟",
type: "bar",
stack: "业务",
data: ["87.54", "88.54", "90", "91", "92", '95', '100'],
barWidth : 25,
label: { // 图形上的文本标签
show: false,
position: 'insideTop', // 相对位置
rotate: 0, // 旋转角度
color: '#eee'
},
itemStyle:{
normal:{color:"#3FBB49"}
}
},
{
name: "常见问题",
type: "bar",
stack: "业务",
data: ["87.54", "88.54", "90", "91", "92", '95', '100'],
barWidth : 25,
label: { // 图形上的文本标签
show: false,
position: 'insideTop', // 相对位置
rotate: 0, // 旋转角度
color: '#eee'
},
itemStyle:{
normal:{color:"#56C4A5"}
},
barCateGoryGap: 15
}
]
};
html调用代码
ECharts
// 基于准备好的dom,初始化echarts实例
var myChart = echarts.init(document.getElementById('main'));
// 使用刚指定的配置项和数据显示图表。
myChart.setOption(option);
myChart.on('click', function (params) {
// 控制台打印数据的名称
console.log(params);
});
转发自
https://www.cnblogs.com/tugenhua0707/p/9380378.html
|