Cesium实战记录(八)三维风场+风速热力图(水平+垂直) |
您所在的位置:网站首页 › cesium绘制点位深度与实践不符 › Cesium实战记录(八)三维风场+风速热力图(水平+垂直) |
Cesium实战记录(八)三维风场+风速热力图(水平+垂直)
|
目录 老规矩首先看下效果 一、风场 1、数据 2、原理剖析 首先,第一步就是构造网格数据 然后,撒粒子 再然后,起风吧 二、热力场 老规矩首先看下效果风场v1.0(平面版,只有U V 方向风速) 三维风场(不带高度) (如果观看不了就点击链接:三维风场(不带高度)_哔哩哔哩_bilibili) 风场v2.0(高度版,加入W垂直风速) 三维风场(带垂直风速) (如果观看不了就点击链接:三维风场(带垂直风速)_哔哩哔哩_bilibili) 风场v1.0结合风速热力图效果(风速只有计算U V 方向) 三维风场叠加风速热力图 (如果观看不了就点击链接:三维风场叠加风速热力图_哔哩哔哩_bilibili) 看完效果,那就开始风场吧 一、风场 1、数据首先是风场的数据格式 气象数据之风向数据json格式解析 - 莫小龙 - 博客园 气象数据之风向数据展示原理 - 莫小龙 - 博客园 这篇博客详细介绍了风场的数据格式,但这个是解析过后的,原始数据一般是netcdf数据或grib2数据,然后解析成类似上面展示的json格式。 其实那个我也没用他的,我只用了东西方向 V 的风速数据 、南北方向 U 的风速数据,垂直方向W 的风速数据 (一般你们不要求高度也不用这个数据,现在网上还没看到用垂直风速的),网格数(宽度+长度),网格的四至范围 ,这些就够了。 其中U 和 V 以及W 的数据是数组格式的,单位是m/s,数据长度是 网格数宽*高。 什么意思呢,你就想象成一个矩形的面,然后划分成多少行多少列(宽的意思就是多少列cols,高的意思就是多少行rows),也就是网上大家普遍说的构造棋盘格。每个格子都有初始的风速,东西方向和南北方向的。 看下我的数据吧
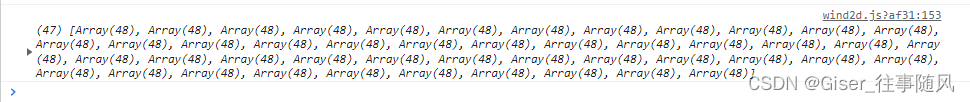
比如说上面风速有2256条数据,就是cols * rows 的数,代表每个47*48个网格里面的风速,分东西和南北的。 max和min就是这个方向上 数组里最大最小值,不是必须的,我是因为业务需要 2、原理剖析根据网上大部队来吧, 首先,第一步就是构造网格数据造好了上述的json数据后,还需要做一步事就是计算水平面上南北和东西方向结合的矢量数据,算向量模长 u*u + v*v 开根号,就是朝这个方向的风速,用来计算下一步风的经纬度的。这个没啥说的吧就是算向量。 看下我的棋盘格数据吧
是47*48条,然后每条数据是【u,v,w, Math.sqrt(u * u + v * v)】,没有高度的就没有w
有了这么多格子,那我们就往这些个格子里面撒点吧,随机撒,以为我们也不知道风的起点在哪里,撒上就算作风的起点了,只需要计算下一步风的走向就行。 按随机撒5000个点吧,让这5000个点落在棋盘格内,(随机数落在四至内,不说了)
其中 age 表述粒子的生命周期, lng,lat,height表示当前位置的经纬度高度, tlng,tlat,theight表示下一步的位置经纬度高度, speed表示水平方向的风速 如果你们用不上高度那就不要。 为什么不能用speed直接成风速呢?因为这个speed是水平方向的风速,他的风速不是m/s而是每一步所走的经纬度,如果你看其他人的源码就知道了,大家都是这么去做的,为什么不看我的源码呢?因为我不准备放我的源码!!! 所以高程点只能通过水平距离去算移动的时间,然后再 乘 垂直方向的风速 m/s (这是我所理解的算法,或许有大佬可以直接算三维向量的模长,算三维方向的风速那也是可以的,但是我就不麻烦了,我分开,水平是水平的,垂直另算) 再然后,起风吧用canvas去做比cesium 的 primitive 效率会高上很多,我也是用canvas去做的。这里用到的是循环去 实现 canvas的画线以及浏览器的刷新机制 requestAnimationFrame 。 好了,到此就全部完成了。(具体的源码我就不放了,因为我也是站在别人的肩膀去完善的,网上也能找到源码,csdn上就有, 大家的源码都是这样的,我的被我改的乱七八糟的,给了也只会误导你们,如果你看了网上还不太明白的,那你联系我,有空我给你解答哈) 最后在插一嘴实现高度的方法,因为网上我没找到有实现高度的,用的都是canvas 2d 的方式,我最后实现了,但其实也是2d方法的,不过我觉得结合three.js去实现 应该可以完美复现三维风场垂直风速的那种效果。 现在说下高度的获取方法吧: 如果用上高度,那我多一嘴,这是网上其他都没有说到的,也是我自己胡JB想的,不知道对不对。 高度计算方法:首先撒完点后,拿到经纬度和下一步的经纬度后,算当前点的贴地高程,算当前点和下一个点的空间距离,计算出距离,比上速度,算出移动的时间,在根据时间 * 当前网格的垂直风速,就是这个点移动到下一个位置所移动的高度,最后再加上当前点的贴地高程即是下个点的高程数据。 二、热力场热力场怎么做呢?在上面我们已经构建好网格数据了,那热力数据就展示每个网格的风速数据,这里我就只展示了uv方向的数据。 算好uv方向的数据,然后撒5000个点,计算每个点落在的网格数据,然后利用二分插值算法找到这个网格内的风速,把这个风速就赋给这个点作为这个点的value。这样一个热力图的数据就做好了。 接下来就是构建热力图层然后叠加了,这个网上都很完善了,我就不写了哈。 最后看下我的热力点位数据吧
如果你看到了这里,那么恭喜你,我最终还是决定把源码放上供大家参考下,但是我事先说明啊,我写的和网上大差不差,但是被我乱改一通。也不设置积分下载了,纯纯福利好不啦~ 不带高度的 /** * @Description:风场 * @author MrKuang * @date 2023/1/13 0013 */ export default class CanvasWindy { constructor(json, params) { this._windData = json; this._viewer = params.viewer; this._canvas = params.canvas; //可配置的参数 this._canvasContext = params.canvas.getContext('2d')// canvas上下文 this._canvasWidth = params.canvasWidth;//画布宽度 this._canvasHeight = params.canvasHeight;//画布高度 this._speedRate = params.speedRate || 50; this._particlesNumber = params.particlesNumber || 5000;//粒子数 this._maxAge = params.maxAge || 120; //粒子生命周期 this._frameTime = 1000/(params.frameRate || 10) ;// 每秒刷新次数 this._color = params.color || '#ffffff'; this._lineWidth = params.lineWidth || 1// 线宽度 // 内置参数 this._grid = []; this._initExtent = []// 风场初始范围 this._calc_speedRate = [0, 0]// 根据speedRate参数计算经纬度步进长度 this._windField = null this._particles = [] this._animateFrame = null// requestAnimationFrame事件句柄,用来清除操作 this.isdistory = false// 是否销毁,进行删除操作 this._init(); } _init() { //创建棋盘格子 this._createWindField(); this._calcStep(); // 创建风场粒子 for (var i = 0; i < this._particlesNumber; i++) { this._particles.push(this._randomParticle(new CanvasParticle())); } this._canvasContext.fillStyle = 'rgba(0, 0, 0, 0.97)' this._canvasContext.globalAlpha = 0.6 this._animate(); var then = Date.now(); let that = this; (function frame() { if (!that.isdistory) { that._animateFrame = requestAnimationFrame(frame) var now = Date.now(); var delta = now - then; if (delta> that._frameTime) { then = now - delta % that._frameTime; that._animate() } } else { that.removeLines() } })() } _animate() { var nextLng = null var nextLat = null var uv = null this._graphicData = []; this._particles.forEach( (particle) => { if (particle.age 0) { var tlng = particle.tlng var tlat = particle.tlat let height = particle.theight; var gridpos = this._togrid(tlng, tlat) var tx = gridpos[0] var ty = gridpos[1] if (!this._isInExtent(tlng, tlat)) { particle.age = 0 } else { uv = this._getIn(tx, ty) nextLng = tlng + this.calc_speedRate[0] * uv[0] nextLat = tlat + this.calc_speedRate[1] * uv[1] particle.lng = tlng particle.lat = tlat particle.x = tx particle.y = ty particle.tlng = nextLng particle.tlat = nextLat particle.age-- } } }) if (this._particles.length { var movetopos = this._tomap(particle.lng, particle.lat, particle) var linetopos = this._tomap(particle.tlng, particle.tlat, particle) if (movetopos != null && linetopos != null) { this._canvasContext.moveTo(movetopos[0], movetopos[1]) this._canvasContext.lineTo(linetopos[0], linetopos[1]) } }) this._canvasContext.stroke() } // 根据粒子当前所处的位置(棋盘网格位置),计算经纬度,在根据经纬度返回屏幕坐标 _tomap(lng, lat, particle) { if (!lng || !lat) { return null } var ct3 = Cesium.Cartesian3.fromDegrees(lng, lat, 0) // 判断当前点是否在地球可见端 var isVisible = new Cesium.EllipsoidalOccluder(Cesium.Ellipsoid.WGS84, this._viewer.camera.position).isPointVisible(ct3) var pos = Cesium.SceneTransforms.wgs84ToWindowCoordinates(this._viewer.scene, ct3) if (!isVisible) { particle.age = 0 } return pos ? [pos.x, pos.y] : null } // 粒子是否在地图范围内 _isInExtent(lng, lat) { if ((lng >= this._windData.xmin && lng = this._windData.ymin && lat = this._windData.rows || y that._frameTime) { then = now - delta % that._frameTime; that._animate() } } else { that.removeLines() } })() } _animate() { var nextLng = null var nextLat = null var uvw = null; this._graphicData = []; this._particles.forEach((particle) => { if (particle.age 0) { var tlng = particle.tlng var tlat = particle.tlat let height = particle.theight; var gridpos = this._togrid(tlng, tlat) var tx = gridpos[0] var ty = gridpos[1] if (!this._isInExtent(tlng, tlat)) { particle.age = 0 } else { uvw = this._getIn(tx, ty) nextLng = tlng + this._calc_speedRate[0] * uvw[0] nextLat = tlat + this._calc_speedRate[1] * uvw[1] particle.lng = tlng particle.lat = tlat particle.x = tx particle.y = ty particle.tlng = nextLng particle.tlat = nextLat particle.height = height; //计算空间距离 let d = mars3d.MeasureUtil.getDistance([new mars3d.LngLatPoint(particle.lng, particle.lat, 0), new mars3d.LngLatPoint(particle.tlng, particle.tlat, 0)]) let t = d / uvw[3]; particle.theight = particle.height + t * uvw[2]; particle.age-- } } }) if (this._particles.length { var movetopos = this._tomap(particle.lng, particle.lat, particle) var linetopos = this._tomap1(particle.tlng, particle.tlat, particle) if (movetopos != null && linetopos != null) { this._canvasContext.moveTo(movetopos[0], movetopos[1]) this._canvasContext.lineTo(linetopos[0], linetopos[1]) } }) this._canvasContext.stroke() } // 根据粒子当前所处的位置(棋盘网格位置),计算经纬度,在根据经纬度返回屏幕坐标 _tomap(lng, lat, particle) { if (!lng || !lat) { return null } var ct3 = Cesium.Cartesian3.fromDegrees(lng, lat, particle.height) // 判断当前点是否在地球可见端 var isVisible = new Cesium.EllipsoidalOccluder(Cesium.Ellipsoid.WGS84, this._viewer.camera.position).isPointVisible(ct3) var pos = Cesium.SceneTransforms.wgs84ToWindowCoordinates(this._viewer.scene, ct3) if (!isVisible) { particle.age = 0 } return pos ? [pos.x, pos.y] : null } _tomap1(lng, lat, particle) { if (!lng || !lat) { return null } var ct3 = Cesium.Cartesian3.fromDegrees(lng, lat, particle.theight) // 判断当前点是否在地球可见端 var isVisible = new Cesium.EllipsoidalOccluder(Cesium.Ellipsoid.WGS84, this._viewer.camera.position).isPointVisible(ct3) var pos = Cesium.SceneTransforms.wgs84ToWindowCoordinates(this._viewer.scene, ct3) if (!isVisible) { particle.age = 0 } return pos ? [pos.x, pos.y] : null } // 粒子是否在地图范围内 _isInExtent(lng, lat) { if ((lng >= this._windData.xmin && lng = this._windData.ymin && lat = this._windData.rows || y |


【本文地址】
今日新闻 |
推荐新闻 |