修改echarts渲染出来的canvas尺寸 |
您所在的位置:网站首页 › canvas怎么改尺寸 › 修改echarts渲染出来的canvas尺寸 |
修改echarts渲染出来的canvas尺寸
|
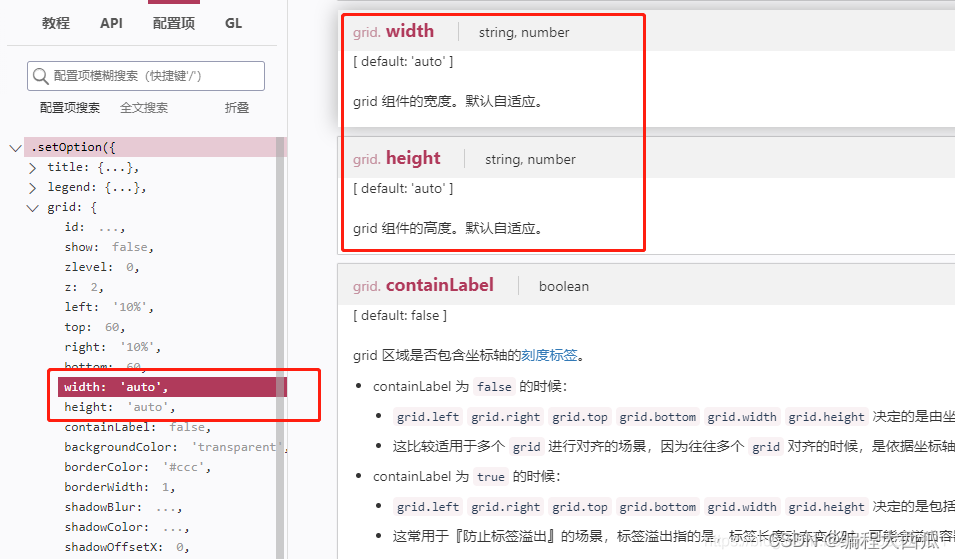
echarts官网demo:https://www.echartsjs.com/examples/zh/index.html#chart-type-line 可以看到渲染出来的canvas全是正方形的,老人直接路过,新手但又有些基础的很多不注意看手册的估计总是忽略一个东西: init的其他参数: //初始化的时候传入 width 和 height 就能改变渲染出来的 canvas大小 (dom: HTMLDivElement|HTMLCanvasElement, theme?: Object|string, opts?: { devicePixelRatio?: number renderer?: string /***这儿***/ width?: number|string height? number|string }) => ECharts还有一个地方:option的grid参数:width和height,init的宽高只是定义的canvas的宽高,grid定义的是内部的图标相对于canvas的宽高,不知道的小伙伴这时候就知道赶紧记录一下: 举个例子: let cityList = ["县1县1", "县2", "县3", "县4", "县5", "县6"]; let baseList = [100000, 15000, 13000, 35000, 34000, 33000]; var dataShadow = []; var yMax = Math.max(...baseList); for (var i = 0; i < baseList.length; i++) { dataShadow.push(yMax); } let option = { color: ["#3398DB"], tooltip: { trigger: "axis", axisPointer: { // 坐标轴指示器,坐标轴触发有效 type: "shadow" // 默认为直线,可选为:'line' | 'shadow' } }, grid: { left: "3%", right: "4%", bottom: "3%", width: "820px", height: "280px", containLabel: true }, xAxis: [ { type: "category", data: cityList, axisTick: { alignWithLabel: true } } ], yAxis: [ { type: "value" } ], series: [ { // For shadow type: "bar", itemStyle: { normal: { color: "rgba(0,0,0,0.05)" } }, barGap: "-100%", barWidth: "15px", barCategoryGap: "40%", data: dataShadow, animation: false }, { name: "购买总人数", type: "bar", barWidth: "15px", data: baseList, itemStyle: { color: "#FDC149" } } ] }; let myChart = this.$echarts.init(this.$refs.totalChart,{width:'880px',height:'300px'}); this.drawImage(myChart, option);
|
【本文地址】
今日新闻 |
推荐新闻 |