Matlab中legend位置 |
您所在的位置:网站首页 › Matlab设置图例位置代码 › Matlab中legend位置 |
Matlab中legend位置
|
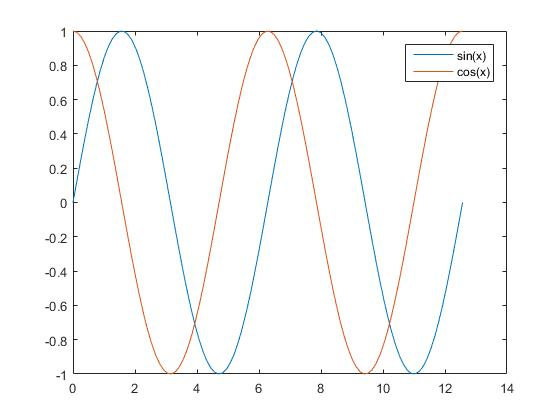
转自:http://blog.sina.com.cn/s/blog_7db803c10102weyk.html Matlab中legend默认的位置在NorthEast,如图所示: %Matlab中legend的位置设置 clc clear close all Npoint = 100; x = linspace(0,4*pi,Npoint); y1 = sin(x); y2 = cos(x); H = plot(x,y1,x,y2); legend('sin(x)','cos(x)');
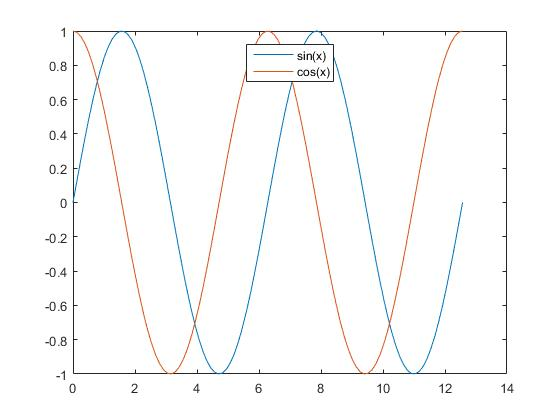
然而,我们却可以通过Location对legend的位置进行改变,变为North,如图所示 %Matlab中legend的位置设置 clc clear close all Npoint = 100; x = linspace(0,4*pi,Npoint); y1 = sin(x); y2 = cos(x); H = plot(x,y1,x,y2); legend('sin(x)','cos(x)','Location','North');
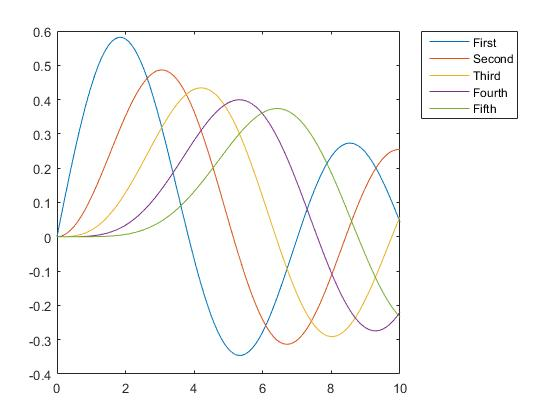
Matlab位置选择 设置 位置 'North' inside plot box near top 'South' inside bottom 'East' inside right 'West' inside left 'NorthEast' inside top right (default for 2-D plots) 'NorthWest' inside top left 'SouthEast' inside bottom right 'SouthWest' inside bottom left 'NorthOutside' outside plot box near top 'SouthOutside' outside bottom 'EastOutside' outside right 'WestOutside' outside left 'NorthEastOutside' outside top right (default for 3-D plots) 'NorthWestOutside' outside top left 'SouthEastOutside' outside bottom right 'SouthWestOutside' outside bottom left 'Best' least conflict with data in plot 'BestOutside' least unused space outside plotMatlab中还可以选择某条曲线legend的指定显示 %Matlab中legend的选择 clc clear close all Npoint = 101; x = linspace(0,10,Npoint); y1 = besselj(1,x); y2 = besselj(2,x); y3 = besselj(3,x); y4 = besselj(4,x); y5 = besselj(5,x); H = plot(x,y1,x,y2,x,y3,x,y4,x,y5); legend('First','Second','Third','Fourth','Fifth','Location','NorthEastOutside')
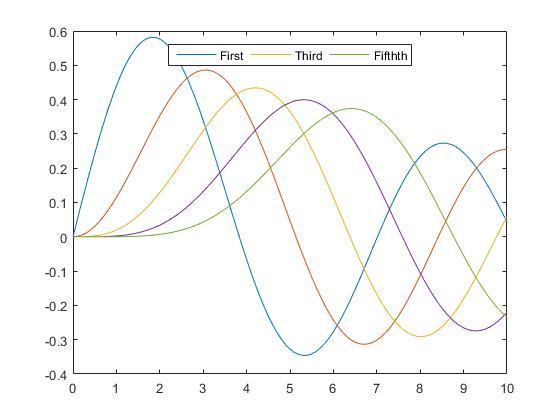
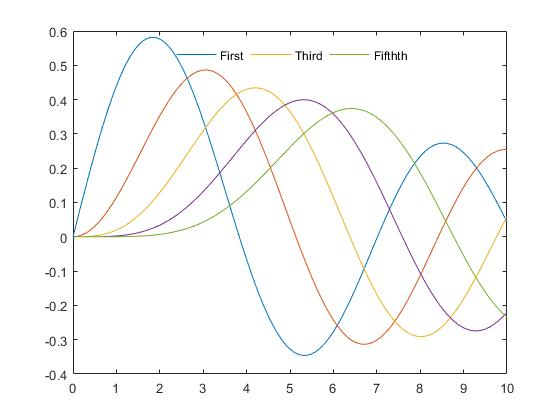
如果只想显示第1、3、5条,也很简单 %Matlab中legend的选择 clc clear close all Npoint = 101; x = linspace(0,10,Npoint); y1 = besselj(1,x); y2 = besselj(2,x); y3 = besselj(3,x); y4 = besselj(4,x); y5 = besselj(5,x); H = plot(x,y1,x,y2,x,y3,x,y4,x,y5); h1 = legend(H([1 3 5]),'First','Third','Fifthth','Location','NorthEastOutside')还可以使用Orientation对legend进行横向排列 %Matlab中legend的横排,注意,Location位置改变为North clc clear close all Npoint = 101; x = linspace(0,10,Npoint); y1 = besselj(1,x); y2 = besselj(2,x); y3 = besselj(3,x); y4 = besselj(4,x); y5 = besselj(5,x); H = plot(x,y1,x,y2,x,y3,x,y4,x,y5); h1 = legend(H([1 3 5]),'First','Third','Fifthth','Location','North'); set(h1,'Orientation','horizon')
不显示方框: clc clear close all Npoint = 101; x = linspace(0,10,Npoint); y1 = besselj(1,x); y2 = besselj(2,x); y3 = besselj(3,x); y4 = besselj(4,x); y5 = besselj(5,x); H = plot(x,y1,x,y2,x,y3,x,y4,x,y5); h1 = legend(H([1 3 5]),'First','Third','Fifthth','Location','North'); set(h1,'Orientation','horizon','Box','off')
|
【本文地址】
今日新闻 |
推荐新闻 |